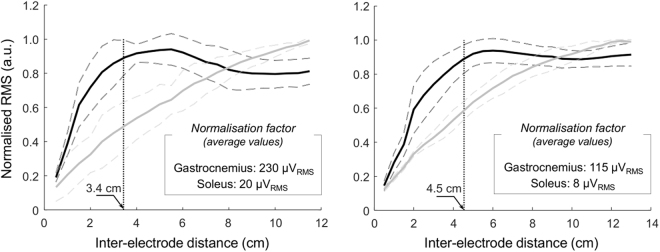
Figure 5.
Root mean square amplitude of soleus and gastrocnemius surface EMGs. Mean (continuous lines) and standard deviation (dashed lines) are shown for the root mean square (RMS) amplitude of surface EMGs triggered by the firing instants of motor units identified from the gastrocnemius (black lines) and soleus (grey lines) muscles. Amplitude values are shown for all inter-electrode distances considered for two participants, ranging from 0.5 cm to 11.5 cm (left panel) and from 0.5 cm to 13.0 cm (right panel). For clarity, RMS values were normalised with respect to the absolute maximal RMS value across motor units and inter-electrode distances, separately for gastrocnemius and soleus muscles. The vertical dotted line indicates the inter-electrode distance for which the mean RMS amplitude of gastrocnemius triggered EMGs reaches 90% of its maximum.

