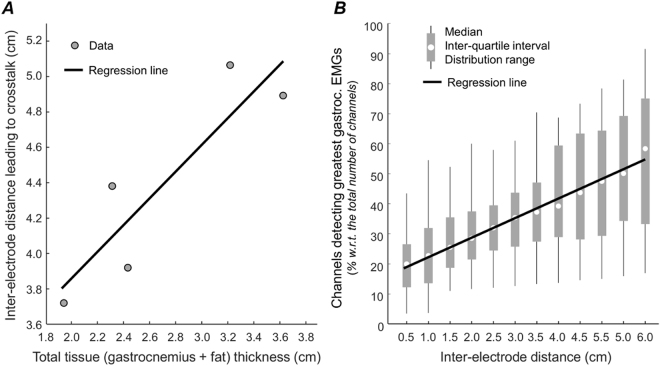
Figure 7.
Tissue thickness and the surface representation of gastrocnemius units. A scatter plot with data obtained from the five subjects tested is shown in (A). The total tissue thickness (subcutaneous plus gastrocnemius thickness) is plotted in the abscissa. The inter-electrode distance over which soleus motor units provided a significant contribution to the surface EMGs (Fig. 5) is shown in the ordinate. Spearman Rho and its significance level were respectively 0.89 and 0.11. (B) shows the distribution of the relative number of channels detecting gastrocnemius surface potentials with amplitude greater than 50% of the maximal amplitude across all subjects and motor units, separately for each inter-electrode distance from 0.5 to 6.0 cm. Spearman analysis indicates a significant correlation between the median, relative number of channels and inter-electrode distance (Rho = 0.98; P < 0.001). Continuous black lines (regression lines) were drawn to indicate the positive trend observed for the data shown in both panels.

