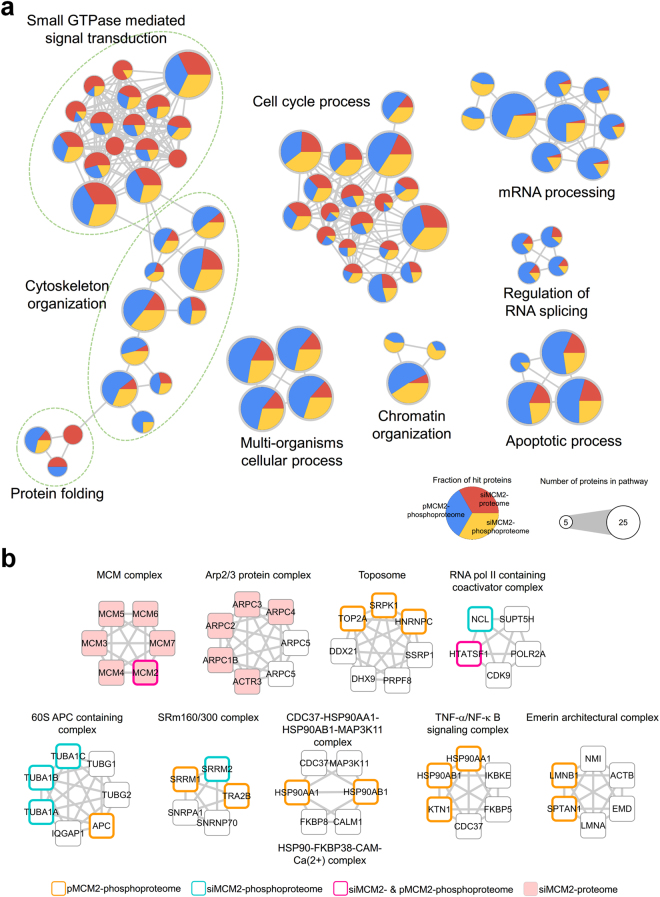
Figure 4.
Functional networks of MCM2-regulated phosphoproteins. (a) Functional enrichment analysis of proteins with differential expression under MCM2 silencing (red) and proteins with differential change in phosphorylation levels under MCM2 overexpression (blue) or silencing (yellow). According to corrected p-value < 0.05, 76 over-represented GO terms were identified. (b) Ten protein complexes that are over-represented in response to MCM were obtained from CORUM. Variable protein members of the complex are colored depending on the phosphoproteomic or global proteomic profiles.

