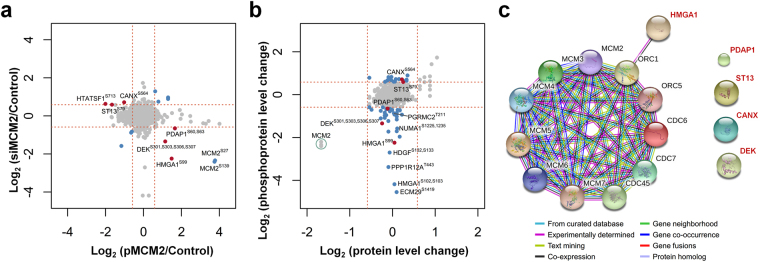
Figure 6.
Identification of MCM2-associated phosphoprotein HMGA1. (a) Comparison of phosphoprotein expression ratios with specific phosphorylation sites from the MCM2 overexpression and silencing phosphoproteomic profiles for two lung cancer cell lines. Phosphoproteins with specific sites that were significantly up- or down- regulated, with at least a 1.5-fold change in opposite directions in the pMCM2 and siMCM2 phosphoproteomes are represented in red. (b) Comparison of changes in protein abundance from the global siMCM2 proteome with changes in phosphoprotein expression ratios from the siMCM2 phosphoproteome in lung cancer cells. Phosphoproteins that were significantly up- or down- regulated by siMCM2 but with no change in protein abundance from the proteome are represented in blue. The phosphoproteins with specific phosphorylation sites that changed in opposite directions in the pMCM2 and siMCM2 phosphoproteomic profiles, without changes in protein abundance, are represented in red. (c) The network predicted a functional association between HMGA1 and the MCM complex. Five MCM2-associated phosphoproteins (HMGA1, PDAP1, DEK, ST13, and CANX) and components of MCM complex are used as seeds to construct a functional association network via STRING.

