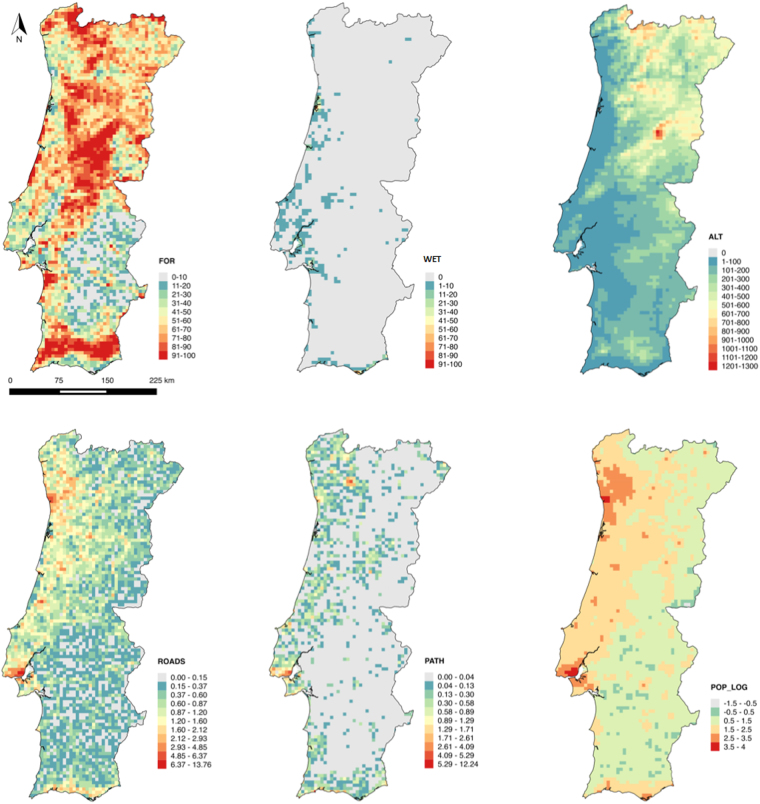
Figure 2.
Explanatory variables tested for spatial association with the distribution of citizen science observations in mainland Portugal (FOR – percentage of cover of forest and natural and semi-natural territories, WET – percentage of cover of wetland territories, ROADS – density of roads, PATH – density of paths and footpaths, POP_LOG – logarithm of human population density, ALT – altitude). Figure created with QGis. 2014. Quantum GIS Geographic Information System. Open Source Geospatial Foundation Project. http://www.qgis.org/en/site/.

