Fig. 3.
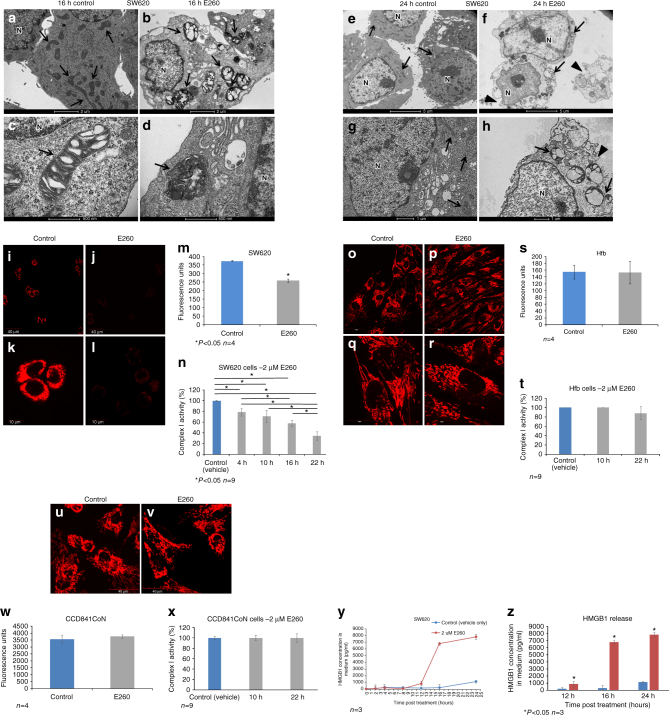
E260 induces selective mitochondrial dysfunction and deformation, and necrotic death in CC cells. TEM analysis of SW620 cells treated with vehicle alone for 16 h (a, c) or 24 h (e, g), and cells treated with 2 µM E260 for 16 h (b, d) or 24 h (f, h). Arrows indicate mitochondria. Arrow heads point to damaged cell membrane. Bars represent 2 µm (a, b, e, f), 1 µm (g, h), and 500 nm (c, d); N nucleus. MMP visualization by TMRE staining (red) in SW620 cells treated with vehicle (i, k), or with 2 µM E260 (j, l) for 16 h. m ELISA quantification of SW620 MMP in control (blue histogram) and in cells treated with 2 µM E260 (gray histogram) for 16 h; n = 4, ±SE. n Complex I activity in SW620 cells treated with 2 µM E260 for increasing periods of time; n = 9, ±SE. MMP visualization by TMRE staining (red) in Hfb cells either treated with the vehicle (o, q) or with 2 µM E260 (p, r) for 16 h. s ELISA quantification of human fibroblast MMP in control (blue histogram) and E260 (gray histogram) treated cells; n = 4, ±SE. Bars represent 40 µm (i, j, o, p) and 10 µm (k, l, q, r). t Complex I activity in Hfb cells treated with 2 µM E260 for increasing periods of time; n = 9, ±SE. MMP visualization by TMRE staining (red) in CCD841CoN cells either treated with the vehicle (u) or with 2 µM E260 (v) for 16 h. w ELISA quantification of CCD841CoN MMP in control (blue histogram) and E260 (gray histogram) treated cells; n = 4, ±SE. x Complex I activity in CCD841CoN cells treated with 2 µM E260 for increasing periods of time; n = 9, ±SE. y Quantification of the HMGB1 concentrations in CC cells growth medium following treatment with control solution or 2 µM E260 for different periods of time. n = 3, ±SE. z HMGB1 concentrations in CC cells growth medium 12, 16, and 24 h post treatment with control (blue histograms) or E260 (red histograms) as in y, with comparative statistical tests. n = 3±SE

