Figure 3.
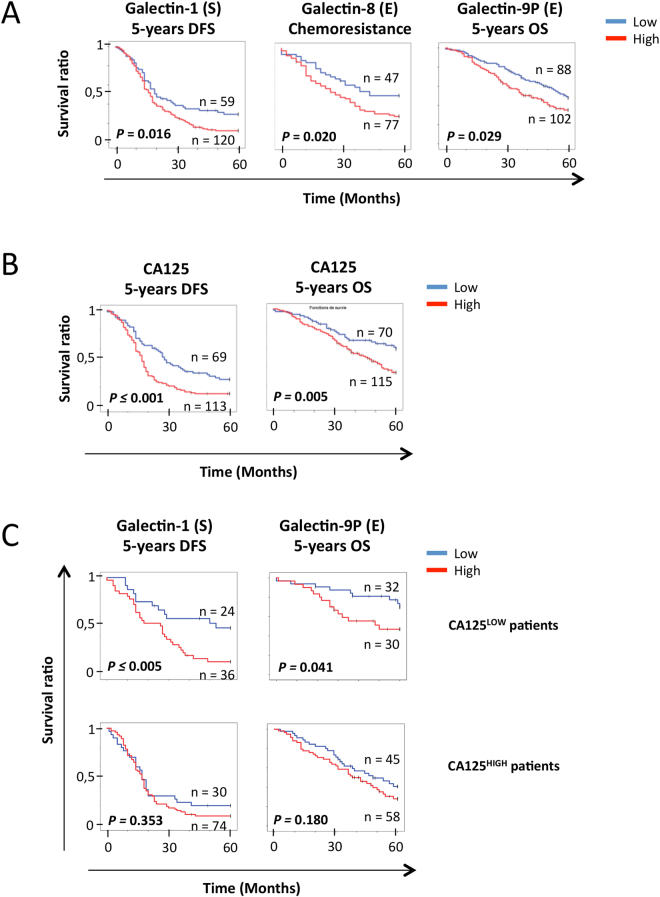
Galectins predictive value of OS, DFS and chemoresistance. (A) Kaplan-Meier curves of 5-years OS, 5-years DFS and chemoresistance according to stromal gal-1, epithelial gal-8 and gal-9P in HGSC samples. Blue bar: galectin low expression, red bar: galectin high expression. (B) Kaplan-Meier curves of 5-years OS and 5-years DFS according to the presence of circulating CA125. Blue bar: CA125LOW samples, red bar: CA125HIGH samples. (C) Kaplan-Meier curves of 5-years OS according to gal-9P presence and 5-years DFS according to stromal gal-1 presence in the tumors of CA125HIGH or CA125LOW patients. Blue bar: galectin low expression, red bar: galectin high expression. (S): Stroma; (E): Epithelium.

