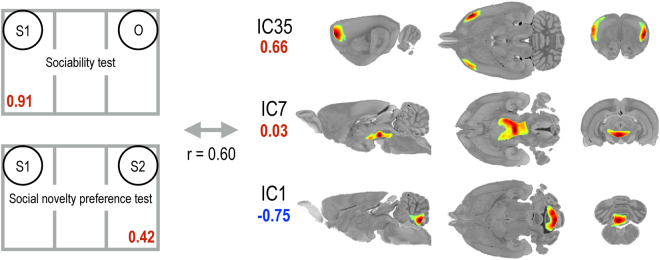
Figure 5.
Spatial patterns associated with normal social behavior revealed by sparse canonical correlation analysis. Normal social behavior was positively correlated with activity in the insular cortex and motor cortex (IC35), as well as that in the ventral tegmental area and hypothalamus (IC7), and negatively correlated with activity in the cerebellum (IC1). The relative contribution of each behavior or IC is shown in numbers. The number in red indicates positive correlation, and the number in blue indicates negative correlation. Each component is shown in sagittal (left), transverse (middle), and coronal (right) planes. IC, independent component.

