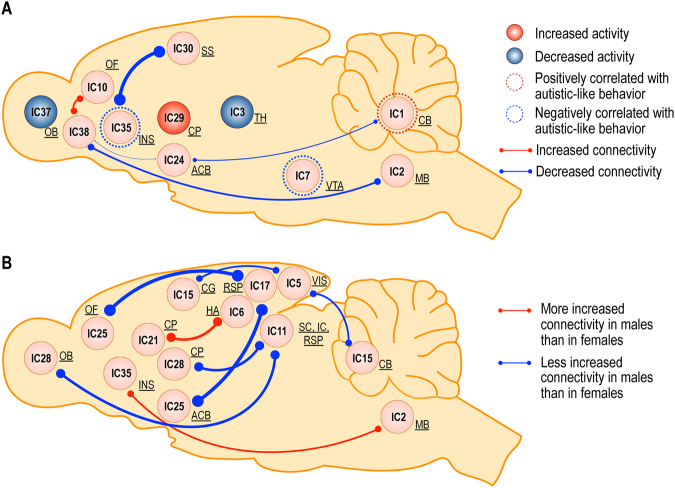
Figure 6.
Activity and connectivity changes induced by prenatal VPA exposure, and brain regions associated with normal social behavior (A) and the effect of VPA exposure on sex (B). (A) The main effects of VPA exposure and the results from sparse canonical correlation analysis are shown. The blue circle indicates the regions with diminished activity in the group exposed to prenatal VPA, while the red circle indicates the regions with increased activity in the VPA exposed group. The blue line indicates the connections weakened in the group exposed to VPA, while the red line indicates the connections strengthened in the VPA exposed group. Line thickness indicates the relative strength of the connections. The blue dashed circle indicates the regions positively correlated with normal social behavior, while the red dashed circle indicates the regions negatively correlated with normal social behavior. (B) Interaction on connectivity between VPA exposure and sex are displayed. The red line indicates the connections more strengthened in males than in females when exposed to VPA, while the blue line indicates the connections less increased in males than in females by VPA exposure. VPA, valproic acid; IC, independent component; NAc, nucleus accumbens; CB, cerebellum; CG, cingulate cortex; CP, caudoputamen; HA, anterodorsal hippocampus; HY, hypothalamus; IC, inferior colliculus; INS, insular cortex; MB, midbrain; OB, olfactory bulb; OF, orbitofrontal cortex; RSP, retrosplenial cortex; SC, superior colliculus; SS, somatosensory cortex; TH, thalamus; VIS, visual cortex; VTA, ventral tegmental area.

