Fig. 1.
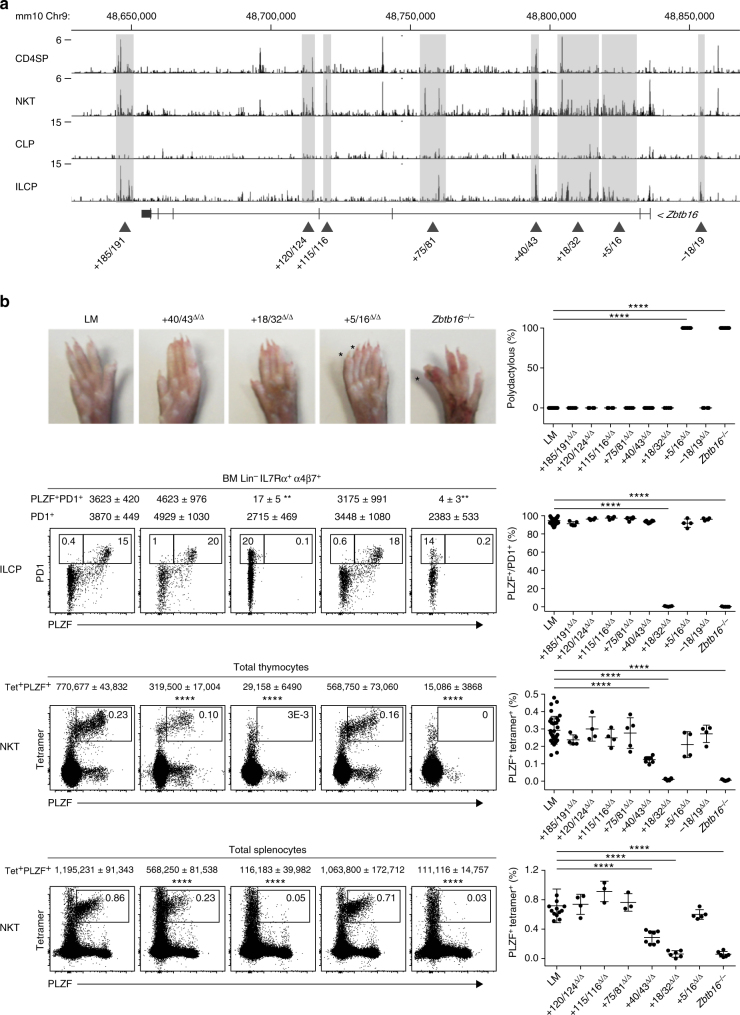
Global functional analysis of the Zbtb16 locus by ATAC-seq and CRISPR/Cas9. a ATAC-seq profiles of the Zbtb16 locus in CD4SP and NKT thymocytes, and in CLP and ILCP bone marrow cells. Shaded areas highlight clusters of peaks selected for CRISPR/Cas9 deletion based on differences in profiles between NKT vs CD4SP or ILCP vs CLP. Data are representative of two to three biological replicates. b Top row Hindlimb autopods of mice carrying different genomic deletions as indicated; extra digits or homeotic transformations of digits are labeled by an asterix and the frequency of mice with digit abnormalities is shown in the summary plot. Second row FACS analysis of PLZF and PD1 expression by BM Lin-IL7Rα+α4β7+ cells from mice carrying indicated CRISPR/Cas9 deletions; absolute numbers (mean ± S.E.M.) of ILCP (PD1+) and PLZF-expressing ILCP (PLZF+PD1+) are indicated on top of the FACS panels; the percentage of PLZF expression by ILCP is compiled in the summary scatter plot. Bottom two rows FACS analysis of CD1d-αGalCer tetramer and PLZF staining among total thymocytes and splenocytes of mice carrying indicated deletions; absolute numbers (mean ± S.E.M.) of NKT (CD1d-αGC Tetramer+PLZF+) and percentages are indicated on top of the FACS panels and in the summary scatter plots respectively. Summary data are pooled from 15 separate experiments, with a total of 4–42 mice in each group. Statistical analysis was performed using one-way ANOVA for multiple comparisons to WT littermate controls (LM). *P < 0.05, **P < 0.01, ***P < 0.001, ****P < 0.0001

