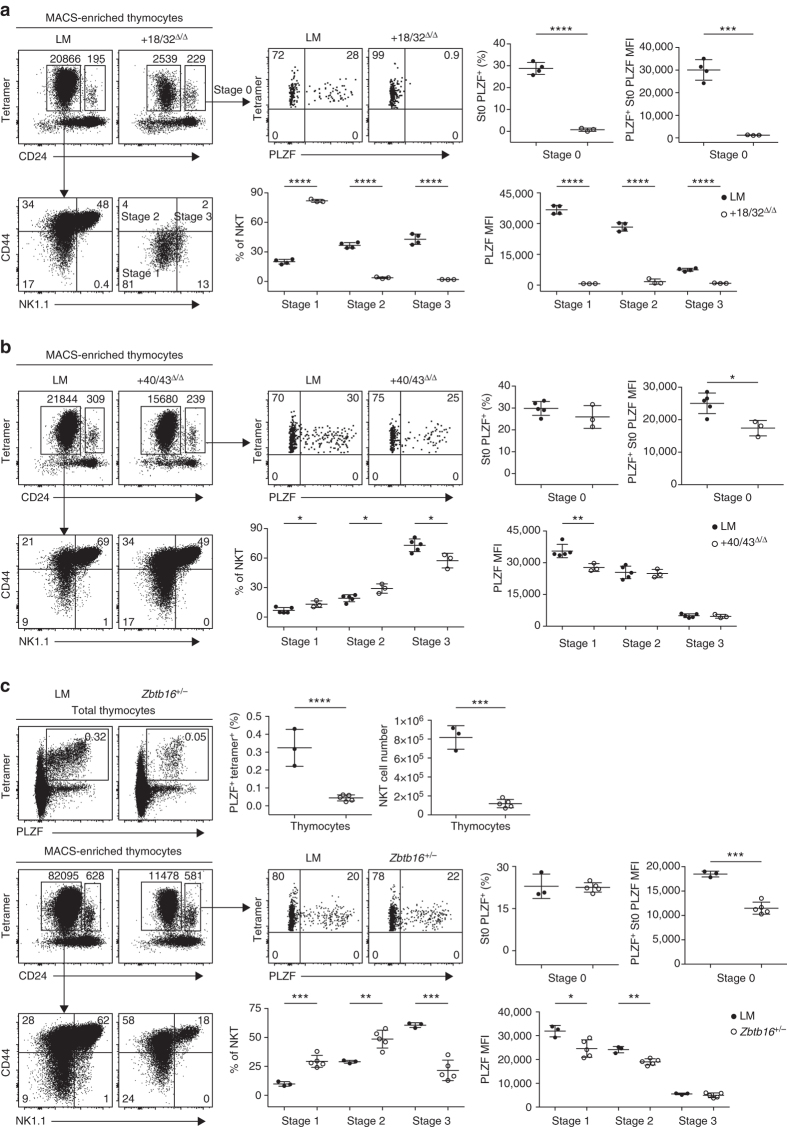
Fig. 2.
NKT phenotype of + 18/32 and + 41/43 deletions. a FACS analysis of CD1d-αGalCer-tetramer+ MACS-enriched NKT thymocytes in mice carrying the + 18/32 deletion compared with WT littermates (LM) mice. Stage 0 NKT (gated as Tetramer+ CD24high) are analyzed for PLZF expression (upper panels). Tetramer+ CD24low NKT are stained for CD44 and NK1.1 to identify stages 1–3 and determine their percentages and PLZF mean fluorescence intensity (MFI) (bottom row). Summary data are combined from two independent experiments, with a total of three to four mice in each group. b FACS analysis of NKT developmental stages and PLZF levels in mice carrying the + 40/43 deletion compared with WT littermate (LM). Data are combined from two independent experiments, with a total of three to five mice in each group. c FACS analysis of NKT thymocytes in Zbtb16 +/− mice. Two-tailed Student’s t-test was performed for statistical analysis. *P < 0.05, **P < 0.01, ***P < 0.001, ****P < 0.0001

