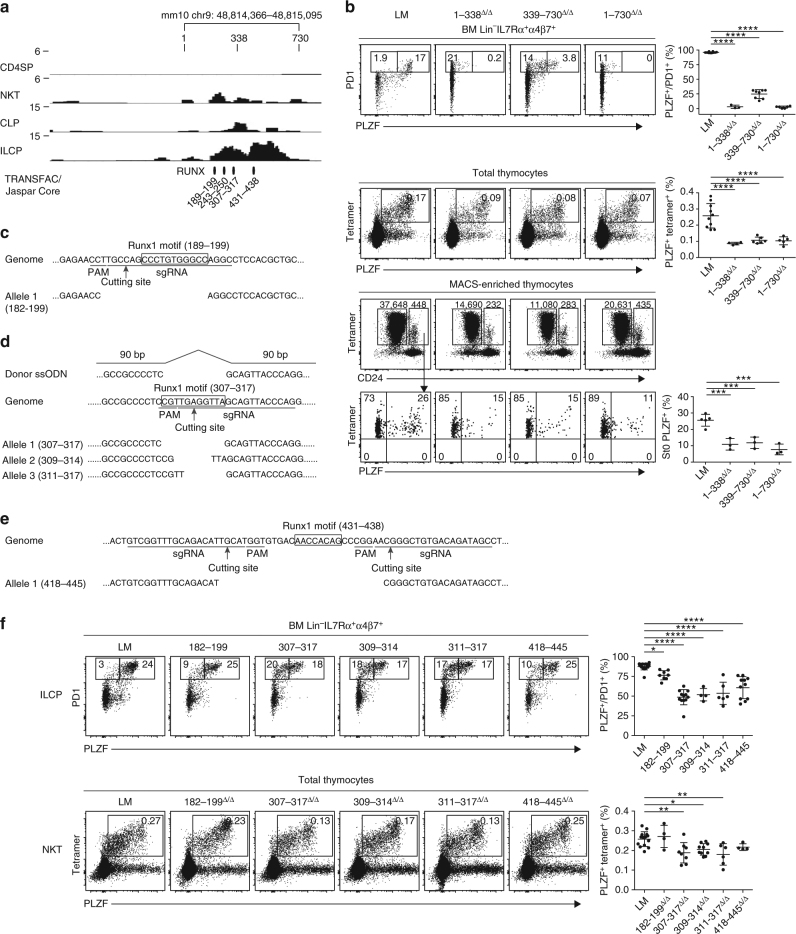
Fig. 5.
Sequence-level analysis of the + 21/23 region. a ATAC-seq profiles of the + 21/23 region in indicated lymphoid populations, magnified from Fig 1a, reveals that all reads are contained within a 730 bp located between mm10 chr9 48,814,346 and 48,815,095. b FACS analysis of BM ILCP (top row), and thymic NKT (second row) in mice carrying indicated deletions, with summary plots on the right column. Bottom two rows shows the FACS analysis of NKT stages 1-2-3 (CD24low) and NKT stage 0 (CD24high) after tetramer-MACS enrichment. The frequency of PLZF expression in stage 0 NKT cells are shown in representative FACS panels and in summary data pooled from two to three independent experiments, with 3–10 mice in each group. c–e Schematic representation of CRISPR/Cas9 targeting of different Runx1 motif-containing sequences. f FACS analysis of BM ILCP cells (top row), and thymic NKT cells (bottom row) in mice carrying indicated deletions, with summary plots on the right column. For ILCP analysis, Runx-motif mutant mice had the second allele carrying the + 18/32 deletion. Summary data are pooled from five independent experiments, with 4–17 mice in each group. One-way ANOVA with multiple comparisons compared to WT were used for statistical analysis. *, P < 0.05, **, P < 0.01, ***, P < 0.001, ****, P < 0.0001

