Fig. 6.
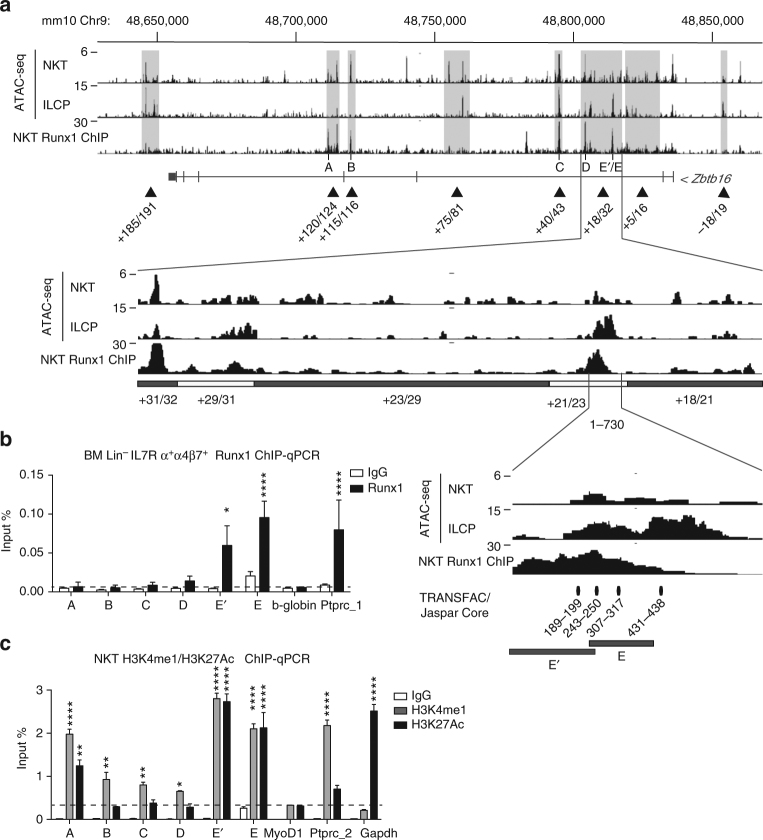
ChIP analysis of Runx1 binding. a Runx1 ChIP-seq profile of the Zbtb16 locus in NKT thymocytes aligned with corresponding ATAC-seq profiles in NKT thymocytes and ILCP cells, with magnification of regions + 18/32 and 1/730 as indicated. b Runx1 ChIP-qPCR analysis of BM Lin-IL7Rα+α4β7+ cells at sites A–E as defined above. Ptprc-1 and b-globin were used as positive and negative control, respectively. Data are combined from three independent experiments. c H3K4me1 and H3K27Ac modifications at the Zbtb16 locus. Ptprc-2 and Gapdh were used as positive controls for H3K4me1 and H3K27Ac, respectively. MyoD1 was used as negative control for both. Data are summarized from three independent experiments. Statistical analysis by one-way ANOVA for multiple comparisons. *P < 0.05, **P < 0.01, ***P < 0.001, ****P < 0.0001

