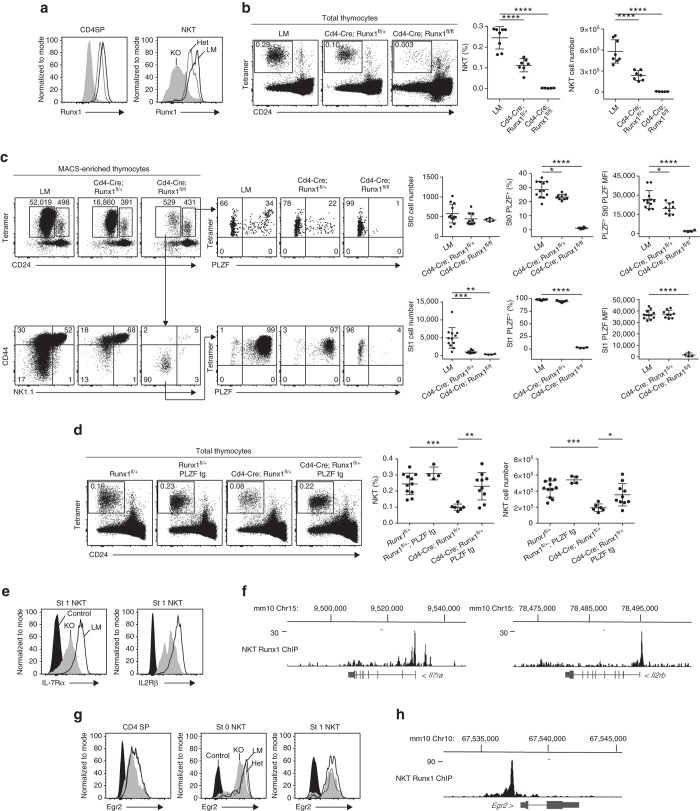
Fig. 7.
Conditional ablation of Runx1 in NKT. a Intracellular flow cytometry for Runx1 expression in thymic CD4SP and NKT cells. (LM controls (LM), solid histogram; Cd4-Cre Runx1 fl/+ (Het), dashed histogram; Cd4-Cre Runx1 fl/fl (KO), gray shaded.) b NKT cells in the thymus of Het and KO compared to their LM. The frequency and absolute cell number of NKT are summarized on the right panels. Data are representative of five to eight mice from four independent experiments. c Individual thymus of indicated strains were MACS-enriched using CD1d-αGalCer tetramers before FACS analysis of NKT developmental subsets and PLZF expression. Data are summarized from four independent experiments, with 4–12 mice in each group. d Rescue of NKT defect in Het by PLZF transgene expression. Data are representative of four to 11 mice from three independent experiments. e Representative FACS analysis of IL-7Rα and IL-2Rβ expression in stage 1 NKT thymocytes from LM and KO; mean ± S.E.M. of mean fluorescence intensity (MFI) is 5535 ± 331 (n = 4) vs 1501 ± 40 (n = 3) for IL-7Rα; and 5721 ± 87 (n = 4) vs 3040 ± 163 (n = 3) for IL-2Rβ, respectively. Leftmost histogram represents unstained control. f Runx1 ChIP-seq tracks at the Il7ra and Il2rb loci. g FACS analysis of Egr2 expression in CD4 SP, stage 0 and stage 1 NKT thymocytes from LM, Het and KO. Mean ± S.E.M. of Egr2 MFI: 2090 ± 84 (LM, n = 5), 1927 ± 45 (Het, n = 4) and 1506 ± 18 (KO, n = 6) in CD4 SP; 9688 ± 461 (LM, n = 5), 8872 ± 389 (Het, n = 4) and 5722 ± 316 (KO, n = 6) in stage 0 NKT; 4174 ± 287 (LM, n = 5), 4310 ± 257 (Het, n = 4), and 3892 ± 216 (KO, n = 6) in stage 1 NKT. h Runx1 ChIP-seq track at the Egr2 locus. Statistical analysis was performed using one-way ANOVA with multiple comparisons. *P < 0.05, **P < 0.01, ***P < 0.001, ****P < 0.0001

