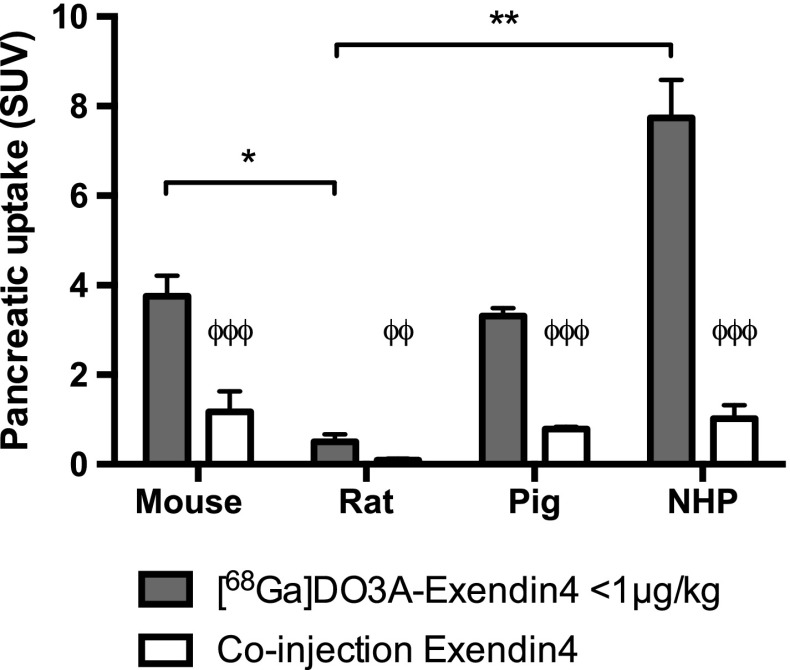
Fig. 4.
In vivo uptake (SUV) of [68Ga]Ga-DO3A-VS-Cys40-Exendin4 in pancreas of different species. Solid bars denote uptake at baseline doses, while blue bars with red stripes white bars denote uptake after co-injection of unlabeled DO3A-VS-Cys40-Exendin4 i.e., non-specific binding. ϕ denote difference in binding of [68Ga]Ga-DO3A-VS-Cys40-Exendin4 from baseline compared to co-injection of unlabeled peptide. Star denotes difference in pancreatic uptake between species at baseline conditions. Error bars represent standard deviations. *denote p < 0.05 and **denote p < 0.01 and ***denote p < 0.001 (color figure online)

