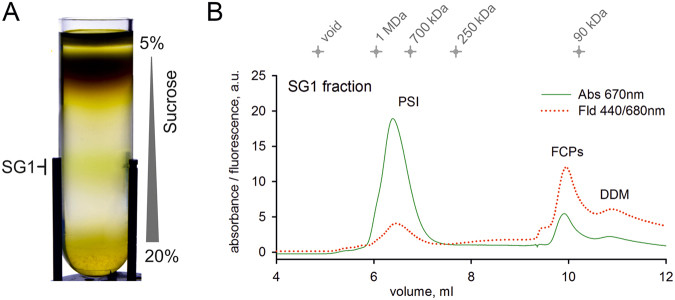
Figure 6.
Isolation of the PSI complex from Chromera. (A) Solubilised membranes were loaded on a sucrose gradient and centrifuged at 75 000 x g for 18 hours; the SG1 (PSI) fraction was then collected and separated on a size-exclusion column (B). Eluted proteins and complexes were detected by a diode-array detector and a fluorescence detector set to 440/680 nm (excitation/emission wavelengths). Chlorophyll absorbance (670 nm) is shown by a green line and chlorophyll fluorescence is shown by a red dotted line; FCP, free antenna proteins. PSI complex, represented by peak 6-7.5 mL, was collected; see also Supplementary Fig. S3.

