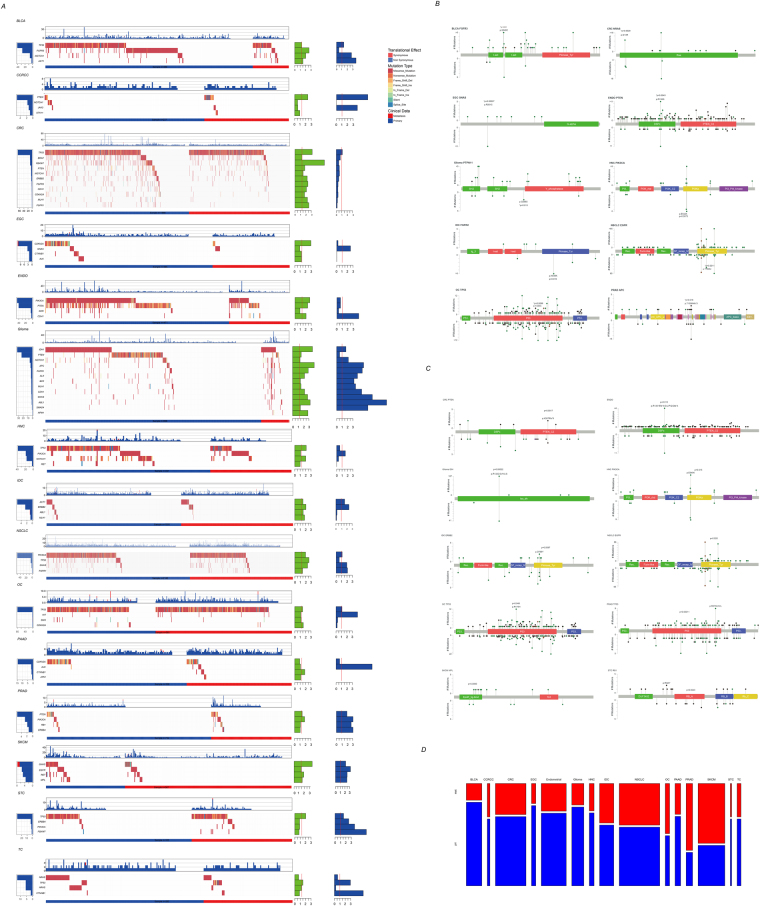
Figure 2.
Mutational difference of primary/metastatic tissues. The differentially mutated genes in cancer types (A). The left panel indicates the mutational rate in metastatic and primary cancerous tissues; the top panel refers to the mutational frequencies of each sample in regions detected; the green barplot in the right panel represents the log2 transformed p values of mutational difference between metastatic and primary tissues; the blue barplot in the right panel indicates the mutational odds ratio of metastatic/primary mutation rates; the middle panel refers to the mutation type of each sample in each gene. The mutational difference between primary and metastatic tissue on each amino acid was shown in needle plot (B). The height represents the mutational counts in different regions and domains, the needles upward indicates the primary and needles on the other side refers to metastatic tissues. The mutational difference between primary/metastatic tissue was also shown (C). Mutational exclusive pairs in primary/metastatic tissues in each cancer type (D). The width of each bar indicates the pair number and the height indicates the proportion.

