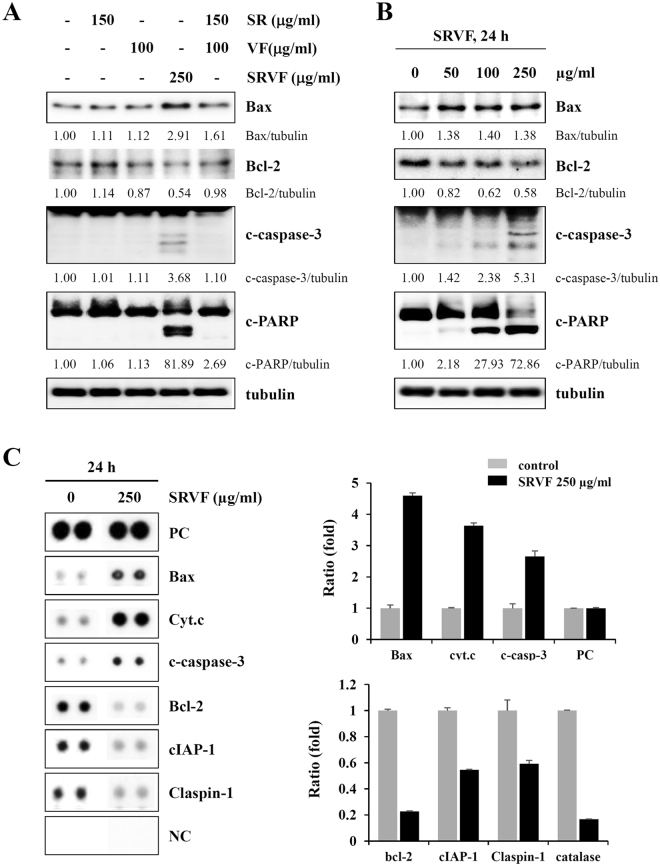
Figure 4.
SRVF induces apoptosis in HT1080 cells. (A) Cells were treated with SR, VF, or SRVF at the indicated concentrations for 24 h and the levels of cell death-related proteins were examined by Western blot analysis. (B) Cells treated with increasing concentrations of SRVF for 24 h were analyzed for cell death-related proteins. Relative band intensities were calculated using ImageJ software after normalizing to tubulin expression. The full size blot is shown in Supplementary Fig. S4. (C) Levels of apoptosis-related proteins in SRVF-treated and –untreated HT1080 cells were determined using the Human Apoptosis Array Kit. Pixel densities were quantified using ImageJ software and the relative ratios compared to untreated control cells are expressed as the mean ± SD calculated from duplicate dots after normalizing to those of the positive control (PC) and negative control (NC).

