Fig. 2.
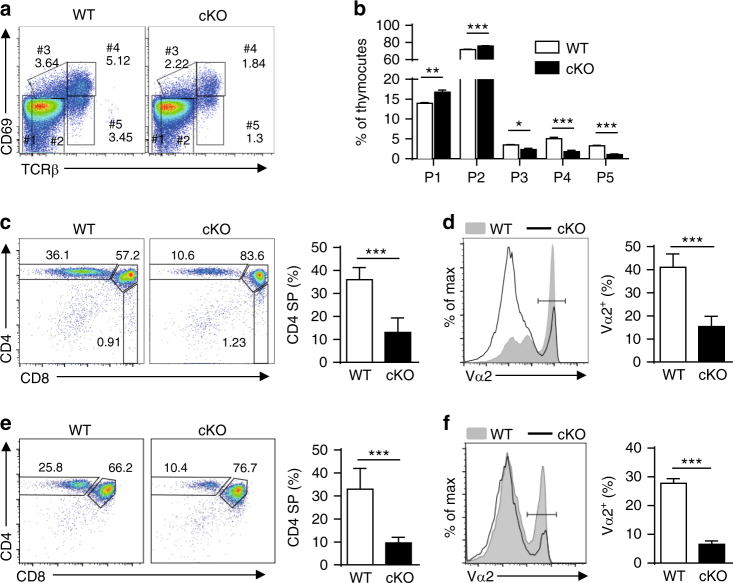
NCoR1 deficiency leads to a blockade in positive selection. a The surface expression of CD69 and TCRβ detected by flow cytometry on NCoR1-deficient (cKO) and wild-type (WT) thymocytes (n = 5 for each group). b Quantification of each subpopulation gated in (a). c, e The expression profiles of CD4 and CD8 (left) on total thymocytes from cKO and WT OT-II TCR-transgenic mice in the Rag1 +/+ (c, n = 4) or Rag1 −/− (e, n = 3) background. The right panel shows the percentages of CD4+ single-positive (SP) thymocytes gated in the left panel. d, f The expression of TCR Vα2 detected by flow cytometry on total thymocytes from cKO and WT OT-II TCR-transgenic mice in Rag1 +/+ (d, n = 4) or Rag1 −/− (f, n = 3) background. The right panel shows the quantification of TCR Vα2+ thymocytes gated in the left panel. The data are representative of three independent experiments (a–f). Statistical significance was analyzed using the two-tailed Student’s t test (*P < 0.05; **P < 0.01; ***P < 0.001)

