
Fig. 5.
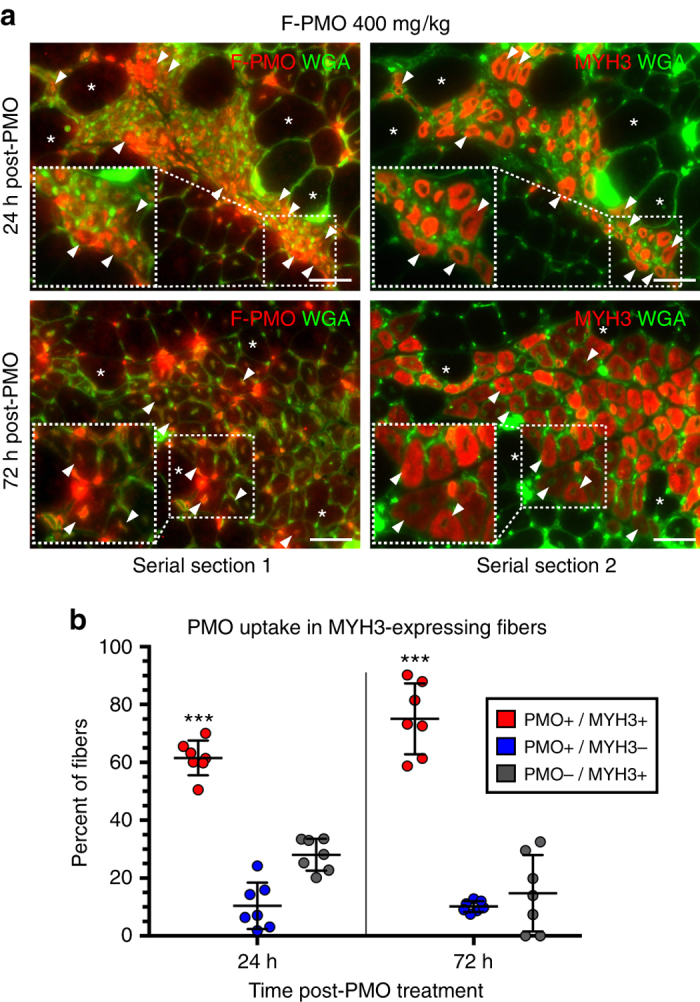
PMO uptake prevalent among actively regenerating myofibers expressing embryonic myosin heavy chain. a PMO localization and uptake specific to regenerating myofiber clusters expressing MYH3, after systemic F-PMO delivery in 4 week mdx mice (400 mg/kg, n = 3). Co-localization of PMO and MYH3+ve myofibers examined in gastrocnemius, quadriceps, and triceps at 24 and 72 h post-PMO delivery. Asterisks denote fiber identity between serial cross-sections; arrowheads denote examples of MYH3+ve myofibers with nuclear PMO. Dashed boxes show magnified inlay; scale bars represent 50 μm. b Quantification of PMO localization in MYH3+ve myofibers shown as percent of labeled fibers. Statistical analysis performed by Mann–Whitney nonparametric test; ***p < 0.001. Data represented as scatter plot with SD