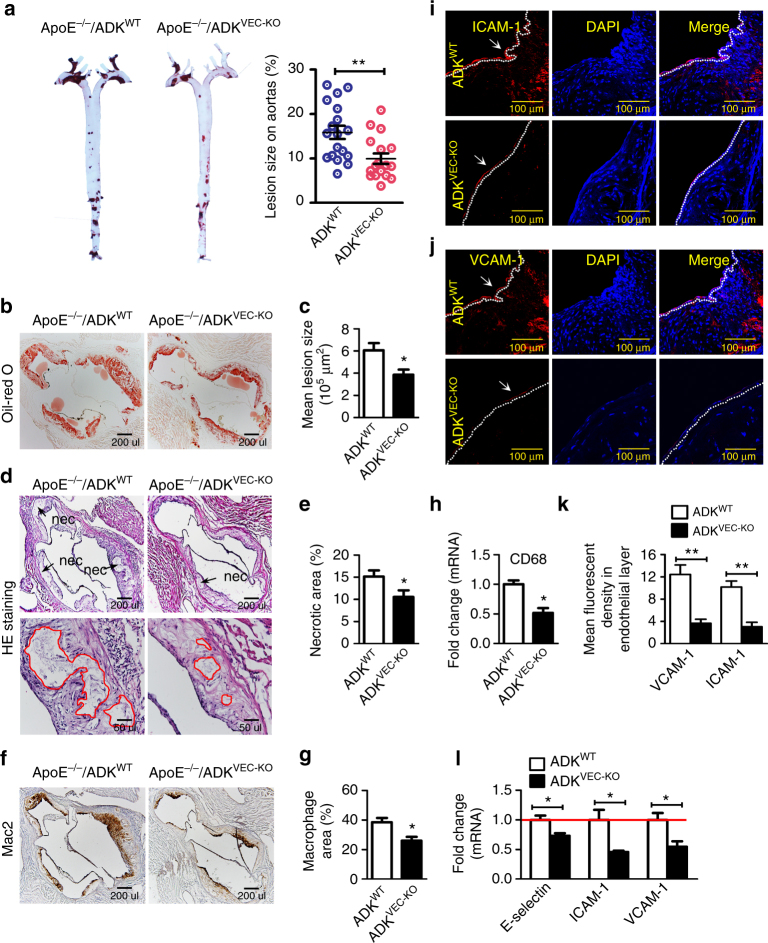
Fig. 6.
Endothelial-specific ADK deficiency prevents atherogenesis. a Oil Red O-stained en face aortic preparations from ApoE−/−/ADKWT and ApoE−/−/ADKVEC-KO mice and quantification of the Oil Red O-stained areas (n = 16–18 mice per group). b, c Oil Red O staining of aortic roots and quantification of lesion area in aortic roots of ApoE−/−/ADKWT and ApoE−/−/ADKVEC-KO mice (scale bar: 200 µm for b; n = 6 mice per group). d, e HE staining of aortic roots and quantification of necrotic areas in aortic roots of ApoE−/−/ADKWT and ApoE−/−/ADKVEC-KO mice (scale bar: 200 µm for upper images and 50 µm for lower images; n = 6 mice per group). Red lines show the boundary of necrotic cores. f–h IHC staining of Mac2 (f; scale bar: 200 µm), quantification of Mac2+ areas in aortic roots (g, n = 6 mice per group), and RT-PCR analysis of mRNA levels of CD68 (h, n = 5 per group) in aortic arches of ApoE−/−/ADKWT and ApoE−/−/ADKVEC-KO mice. i–k Immunofluorescent staining of ICAM-1 (i; scale bar: 100 µm) and VCAM-1 (j; scale bar: 100 µm) in aortic roots, and quantification of ICAM-1 and VCAM-1 expression in endothelial layer in aortic roots from ApoE−/−/ADKWT and ApoE−/−/ADKVEC-KO mice (k, n = 6 mice per group). l RT-PCR analysis of mRNA levels of adhesion molecules in aortic arches of ApoE−/−/ADKWT and ApoE−/−/ADKVEC-KO mice (n = 5 mice per group). All images are representative. For all bar graphs, data are the mean ± SEM, *P < 0.05 and **P < 0.01 (Unpaired, two-tailed Student’s t-test)

