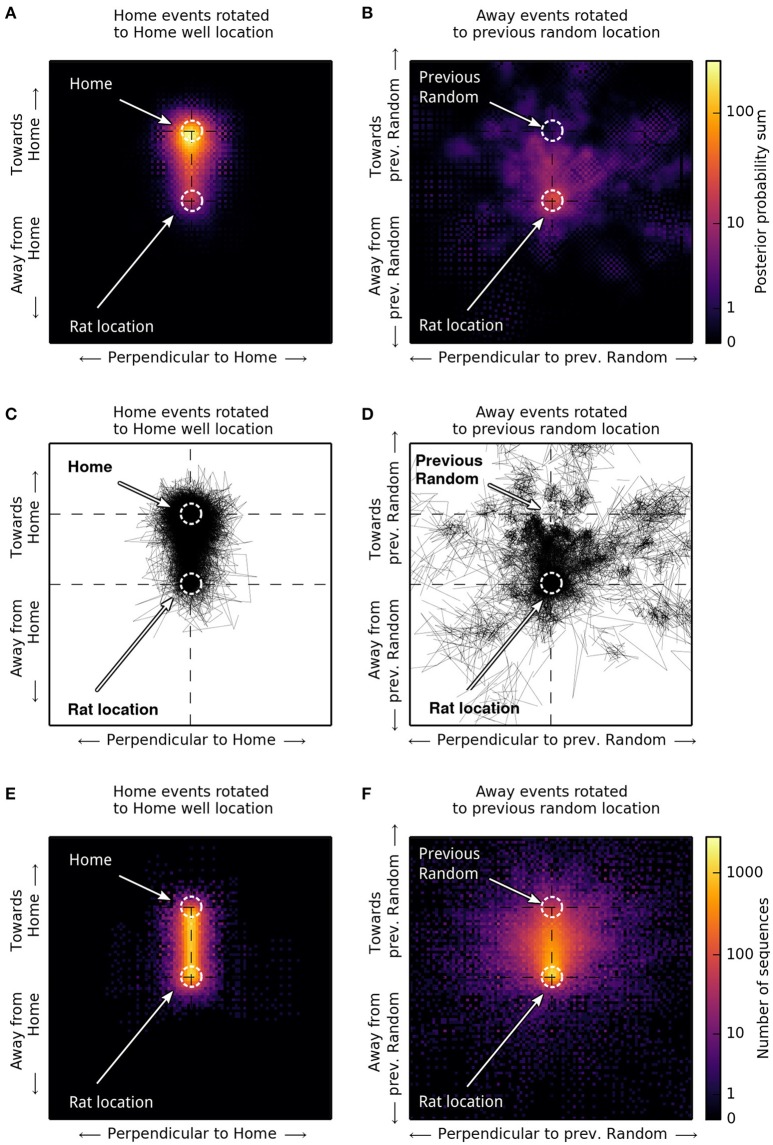
Figure 8.
Spatial distribution of sequence trajectories. For comparison with Figure 4A,B in Pfeiffer and Foster (2013), we scaled and rotated sequence trajectories to illustrate their spatial distribution relative to the Home reward location (A,C,E) for Home trials, or relative to the previous Random reward location during Random trials (B,D,F). (A,B) Posterior probability sums of 480 sequences obtained from 12 networks using Bayesian decoding. (C,D) Corresponding decoded sequence trajectories. (E,F) Trajectories of 5,760 sequences obtained from all 144 networks using population vector decoding. Sequence trajectories in Home trial phases are strongly biased to proceed toward the Home location (A,C,E). In Random trials, trajectories are biased to proceed toward the previous Random reward location but show a broader spatial distribution (B,D,F).

