Figure 1.
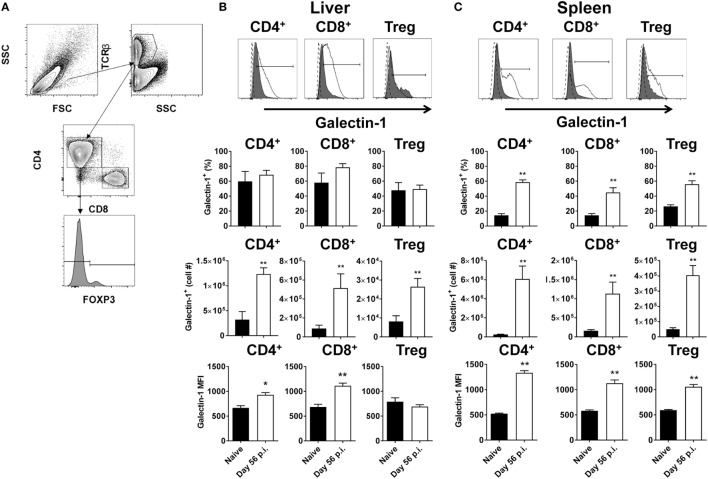
Galectin-1 expression on T cell subsets during established infection. Galectin-1 expression on T cell subsets from C57BL/6 mice (n = 5) infected with Leishmania donovani (day 56 p.i.) was assessed by flow cytometry and compared with naïve control animals. The gating strategy used to identify conventional (Foxp3−) CD4+, CD8+, and regulatory (Foxp3+) T cells is shown (A). The frequency and number of galectin-1-positive cells, as well as the relative expression of galectin-1 determined by mean fluorescent intensity (MFI) from histograms shown for the liver (B) and spleen (C) were measured, as indicated. The dotted histograms represent staining with the isotype control antibody, dark gray histograms reflect cells from naïve animals, and white histograms reflect cells from infected animals. These data represent one of two separate experiments (*p < 0.05, **p < 0.01; Mann–Whitney test, relative to naïve).

