Figure 2.
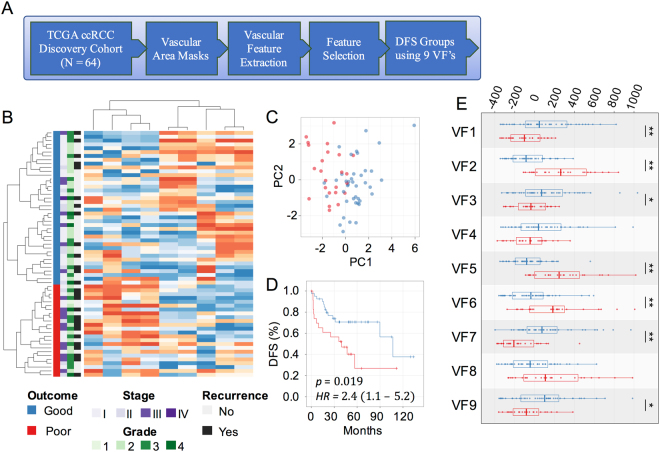
9 vascular features (VF) predict disease free survival (DFS) in ccRCC. (A) Workflow diagram for predicting outcomes with selected vascular features in the ccRCC discovery cohort (N = 64). (B) Hierarchical clustering of the 64 cases by 9 vascular features into two risk groups. Blue – low risk, red – high risk. (C) Principal component analysis demonstrating the first two principal components of the 9 selected VF’s. (D) Kaplan-Meier plot using 9VF’s to separate patients into low- and high-risk groups (HR = 2.4, 95% C.I. = 1.1–5.2). (E) Box plot of VF expression in good and poor DFS risk groups (two-tailed t-test *p < 0.1, **p < 0.05). The 9VF’s are described in Table 1 and Supplementary Table S7.

