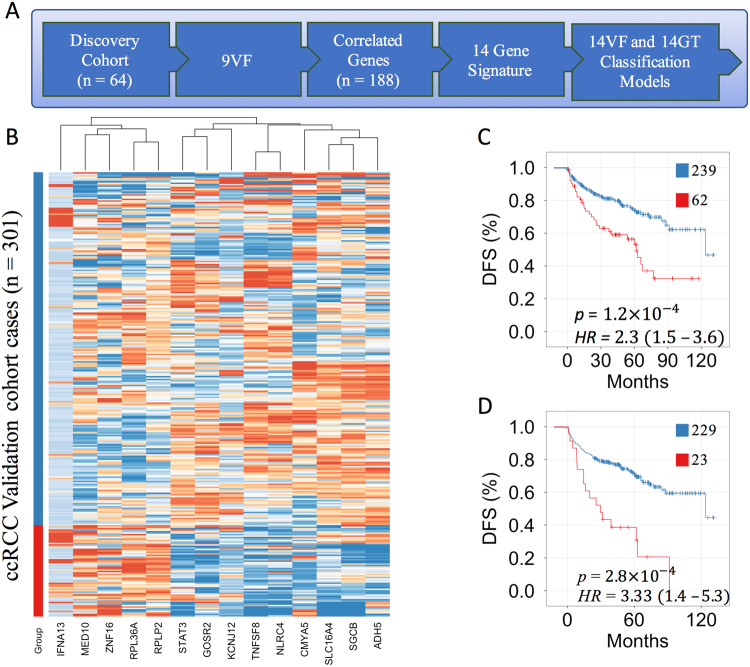
Figure 3.
A 14-gene expression signature predicts disease free survival in ccRCC. (A) Workflow diagram of selecting 14 genes correlated to 9 VF’s and training of two outcomes prediction models in the discovery cohort (N = 64). The 14VF classifier was trained on the risk groups defined by 9VF’s. The 14GT classifier was trained on 24-months disease free survival status. (B) Supervised clustering based on low risk (blue) and high risk (red) groups obtained from the 14VF model in the validation cohort (N = 301). (C) Kaplan-Meier plot of the 14VF model (n = 207, log-rank test p < 0.001, HR = 2.3). (D) Kaplan-Meier plot of the 14GT model (n = 257, log-rank test p < 0.001, HR = 3.33).

