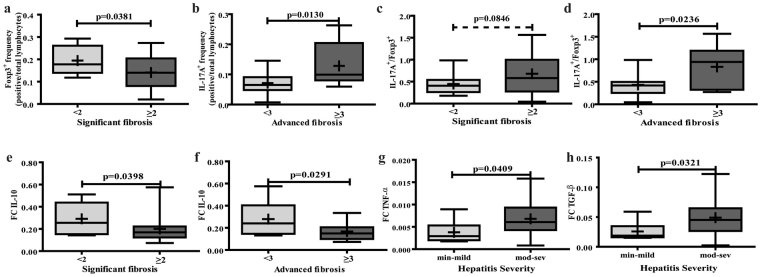
Figure 3.
Liver microenvironment related to liver damage. Association between: (a) Foxp3+ lymphocyte frequency and significant fibrosis, (b) IL-17A+ lymphocyte frequency and advanced fibrosis, (c) IL-17A+/Foxp3+ lymphocytes ratio and significant fibrosis (trend of association), (d) IL-17A+/Foxp3+ lymphocytes ratio and advance fibrosis, (e–f) IL-10 expression level with significant and advanced fibrosis, respectively, (g–h) TNF-α and TGF-β expression level with hepatitis severity, respectively. Significant (F ≥ 2) and advanced (F ≥ 3) fibrosis according to METAVIR. Hepatitis severity (min: minimal; mod: moderate, sev: severe) according to HAI. The results are depicted in box plots. Horizontal lines within boxes indicate medians. Horizontal lines outside the boxes represent the 5 and 95 percentiles. Mean is indicated as + . Frequencies were calculated as immunostained P-P/I lymphocytes/ total P-P/I lymphocytes in all portal tracts of the tissue section (400×). FC: fold change. The unpaired t-test (a,c,f,g and h) and Mann-Whitney U-test (b,d and e) were used to compare sets of data.

