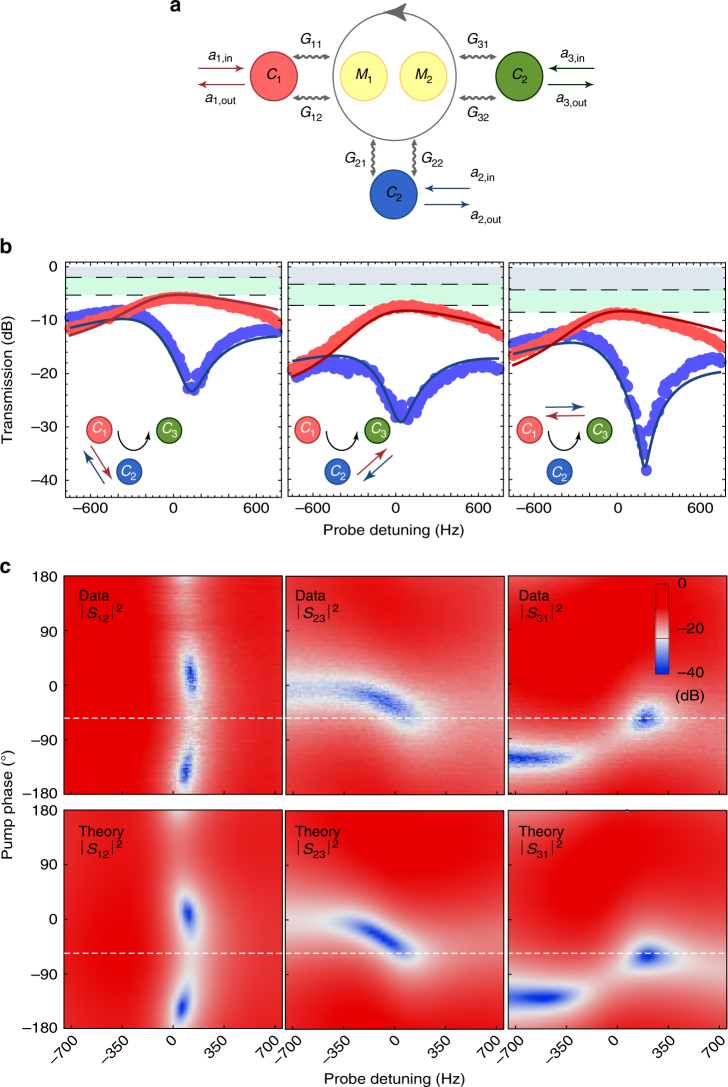
Fig. 3.
Electromechanical circulator. a Mode coupling diagram describing the coupling between three microwave cavities (C 1, C 2 and C 3) and two mechanical modes (M 1 and M 2) with electromechanical coupling rates G ij (where i = 1, 2, 3 and j = 1, 2), creating a circulatory frequency conversion between the three cavity modes, as indicated by the grey arrow. b Measured power transmission in forward |S 21|2, |S 32|2 and |S 13|2 (red dots) and backward directions |S 12|2, |S 23|2 and |S 31|2 (blue dots) as a function of probe detuning for a pump phase ϕ = −54º. The solid lines show the prediction of the coupled-mode theory model discussed in the text. The inset shows the signal propagation between the three resonator modes and the black arrow indicates the circulator direction. Grey shaded areas denote cavity loss and green shaded areas insertion loss. c Measured S parameters and theoretical model as a function of detuning and pump phase. Dashed lines indicate the line plot positions shown in b

