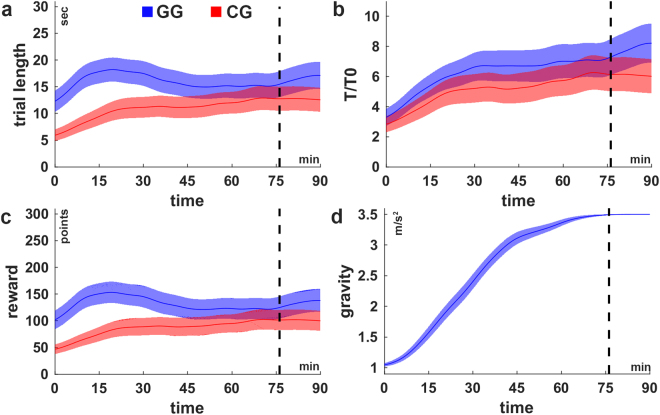
Figure 2.
Learning curves. (a) Trial length, (b) normalized trial length (T/T0), (c) cumulated reward per trial across the experimental duration in the conditions GG (blue) and CG (red). The normalized trial length (b) reveals a monotonic improvement for both groups whereas the other measures (trial length and reward) are non-monotonic. (d) The average increase of the gravity of subject in condition GG. The shaded areas indicate the inter-subject-variability (±1SEM). The black dashed lines indicate the time at which all subjects in condition GG have reached maximum gravity (gmax = 3.5 m/s2) latest. For the purpose of illustration, the curves were smoothed over time using the weighted running average method.

