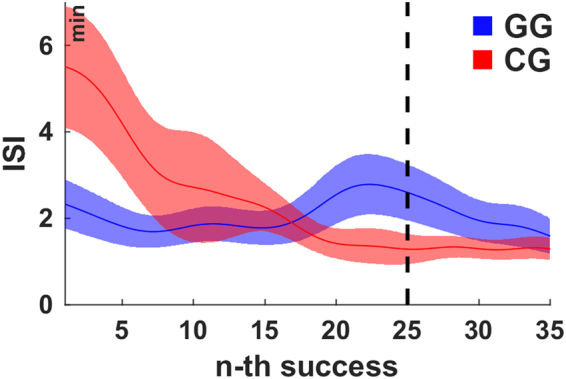
Figure 3.

The average inter-success intervals for the first 35 successes. The inter-success intervals (ISI) in condition CG decrease monotonically whereas in condition GG an intermediate increase is observable just before subjects reached the maximum gravity after 25 successes. The shaded areas indicate the inter-subject-variability (±1 SEM). The black dashed line indicates the time at which all subjects in condition GG have reached maximum gravity (gmax = 3.5 m/s2) latest. For the purpose of illustration, the curves were smoothed over time using the weighted running average method.
