Figure 7.
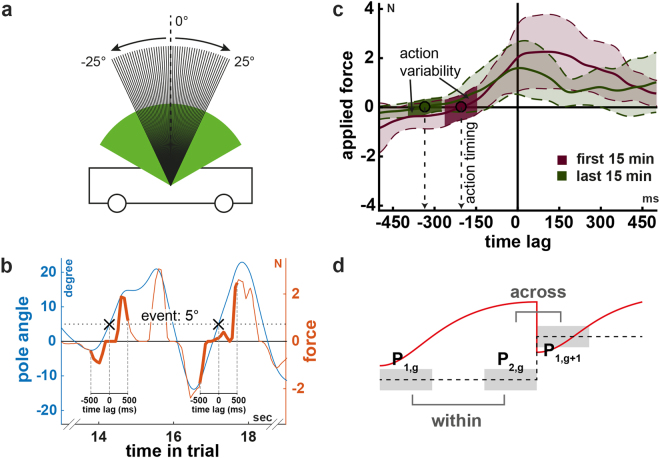
Schematic of the action timing and the change of measures as function of the gravity. (a) All pole angles investigated as events (integer valued pole angles from −25 to 25°). The arrows indicate the direction of the pole movement. (b) Pole angle (blue) and input force (orange) trajectories in a representative trial illustrating two event occurrences (black crosses) and corresponding two force segments (thick lines). Negative force values correspond to a leftwards force. Aligning all segments that correspond to one event and averaging the segments over different trials in a window of 2 minutes yields similar curves to those shown in panel c. (c) Average force segments of a representative subject for two periods during learning (first 15 minutes: purple, last 15 minutes: dark green) for illustrating the action timing and variability measures. The circles indicate the time (action timing) when the subjects changed the direction of the force relative to the occurrence of the event (zero time lag). Negative and positive time lags represent the time before and after the event. As expected, early (first 15 minutes, purple) during learning actions are performed rather in reaction to event occurrences (towards positive time lags) whereas learning leads to the ability to make actions predictively (more negative time lag, dark green). Coloured areas illustrates the variability in force segments. The dark coloured areas indicate the action variability. It is the average standard deviation of the force segments ± 60ms around the zero crossing (action timing). The variance in input force round the zero crossing (action variability) is lower for actions late during learning (last 15 minutes), suggesting more consistency. (d) Illustration of the procedure to examine changes in different measures relative to an increase in gravity. We here show exemplarily the trial length (red curve) in relation to the gravity (dashed line). The light grey areas illustrate the periods under investigation. Subtracting the average trial length in the highlighted periods yields the change within (P2,g − P1,g) and across (P1,g+1 − P2,g) the gravity step(s).

