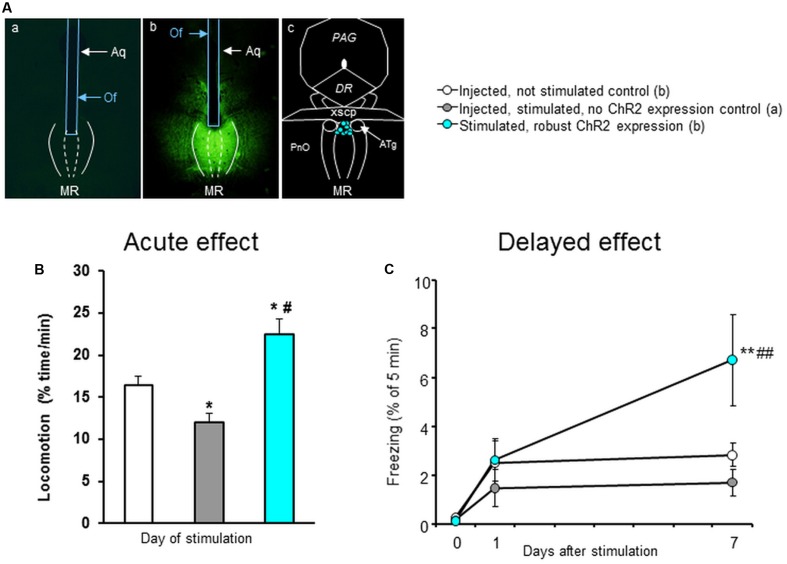
FIGURE 2.
Optogenetic stimulation of MRR in a novel cage. (A) Representative photomicrographs showing the distribution of ChR2 in the MR (as visualized by GFP distribution) in mice where no ChR2 expression was present (a) or where it was robust (b) and the location of optrode tips in stimulated mice (c). (B) Locomotion counts, calculated as line crossings, for the whole duration of the experiment. (C) Freezing behavior during the 20 Hz stimulation (Day0) and 1 (Day1) and 7 days (Day7) later. Aq, aqueduct; ATg, anterior tegmental nucleus; DR, dorsal raphe; MRR, median raphe region; Of, optic fiber; PAG, periaqueductal gray; xscp, decussation of the superior cerebellar peduncle; Results were analyzed by one-way ANOVA (B), and two-way repeated measure ANOVA (C), followed by Newman–Keuls test, ∗ p < 0.05 or ∗∗p < 0.01 significant difference from injected, not stimulated control; #p < 0.05 or ##p < 0.01 significant difference from injected, stimulated, no ChR2 expression control.

