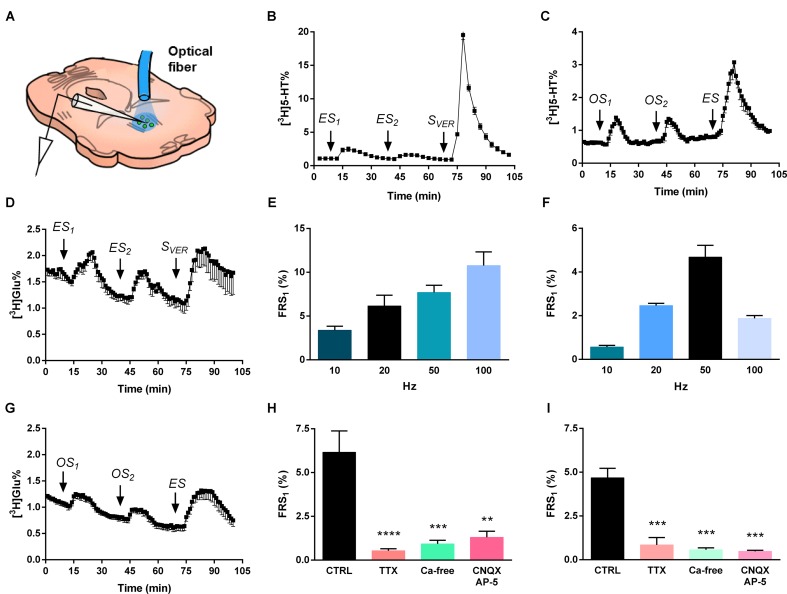
FIGURE 4.
Electrical and optical stimulation induces release of [3H]5-HT and [3H]Glu from the MRR. (A) [3H] neurotransmitter release was measured from superfused coronal slices containing the MRR of virus-injected mice in response to different stimulations. The schematic figure illustrates the position of optical fiber and bipolar electrode. (B,C) [3H]5-HT release in response to electrical (20 Hz) (B) and optogenetic (50 Hz) (C) stimulation. ES is an electrical, SVER is a chemical (veratridine, 20 μM) and OS is a light stimulation, n = 4–5 mice. (E,F) Frequency-dependence of [3H]5-HT release from MRR, n = 4–5 mice on each frequency. We used different frequencies (10, 20, 50, 100 Hz) with unchanged other stimulation parameters. (H,I) Effects of TTX, CNQX-DL-AP-5 and Ca2+-free conditions on the electrical (20 Hz) (H) and optical (50 Hz) (I) stimulation-evoked release of [3H]5-HT from MRR. Ca2+-free Krebs’ solution was perfused from 60 min before the start the sample collection, while TTX and CNQX-AP-5 was administered 15 min before first collected sample and until the end, n = 4 mice per group. (D,G) 50 Hz electrical stimulation (D) and 50 Hz optical stimulation (G) induces release of [3H]Glu from MRR, n = 3–6 mice. The tritium content in the perfusate samples (B–D,G) was expressed as fractional release (FR%) and is shown as a function of time. Curve shows the mean ± SEM of the identical experiments. Arrows indicate the time of different type of light, electric and chemical stimulations. (E,F,H,I) The results are expressed as the net release of tritium evoked by the first electrical or optical stimulation period (FRS1, %). (H,I) Results were analyzed by one-way ANOVA, followed by Dunnett test, ∗∗∗∗p < 0.0001, ∗∗∗p < 0.001, ∗∗p < 0.01. Asterisks indicate significant differences from control. (A) image is a modification of the original one from the article of Dugue et al. (2014).

