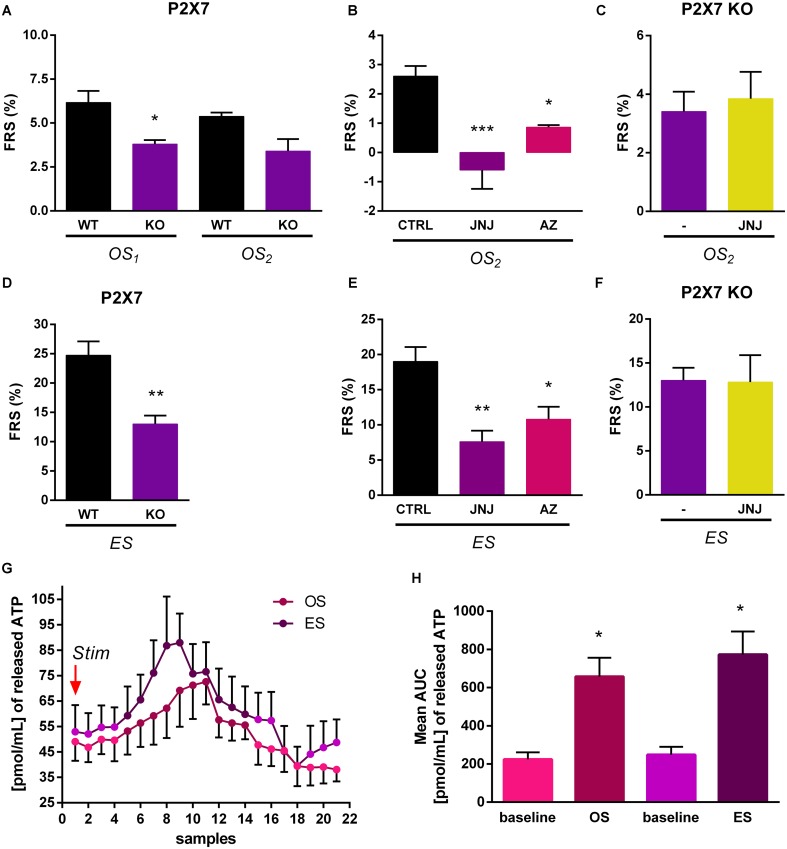
FIGURE 6.
Optically and electrically evoked tritium efflux was lower in KO than in WT mice. (A,D) Optically (50 Hz) (A) and electrically (50 Hz) (D) induced tritium release in WT and KO mice (n = 5 mice per group). (B,E) JNJ-47965567(JNJ) and AZ-10606120 (AZ) significantly decreased the release of [3H]5-HT elicited by light (50 Hz) (B) and electrical (50 Hz) (E) stimulation from HP slices in WT mice (n = 4 mice per group). (C,F) Treatment with the P2X7 receptor antagonist, JNJ-47965567 did not decreased significantly the tritium efflux elicited by light, OS2 (50 Hz) (C) and electrical, ES (50 Hz) (F) stimulation from HP slices in KO mice (n = 4 mice per group). In every case, we used the protocol of Experiment 2 (see Figure 3) and JNJ-47965567 was added to the perfusion solution 15 min before second light stimuli. (G,H) Optical and electrical stimulations increased the endogenous ATP release in the HP of virus injected WT mice. We used the protocol of Experiment 2. Stim (G) indicates the first optical (OS1) and last, electrical stimulation (ES). The two types of stimulation applied at 50 Hz with same parameters, but not in the same time. X-axis shows the 1 min perfusate samples from the starting of stimulation. Graph in panel (H) represents the area under curve (AUC) values. Baseline is the mean ATP content expressed by AUC method before OS and ES stimulation. (A–F) OS1 and OS2 is a light stimulation and ES is an electrical stimulus. The results are expressed as the net release of tritium evoked by the optical or electrical stimulation period (FRS, %). (G) Data are expressed as pmol/mL of released ATP as means ± SEM (n = 6 per group). Results were analyzed by one-way ANOVA, followed by Scheffe (A,C,D,F) and Dunnett test (B,E), and Kruskal–Wallis ANOVA with Dunn’s test (H), ∗p < 0.05, ∗∗p < 0.01, ∗∗∗p < 0.001. Asterisks indicate significant differences from control.

