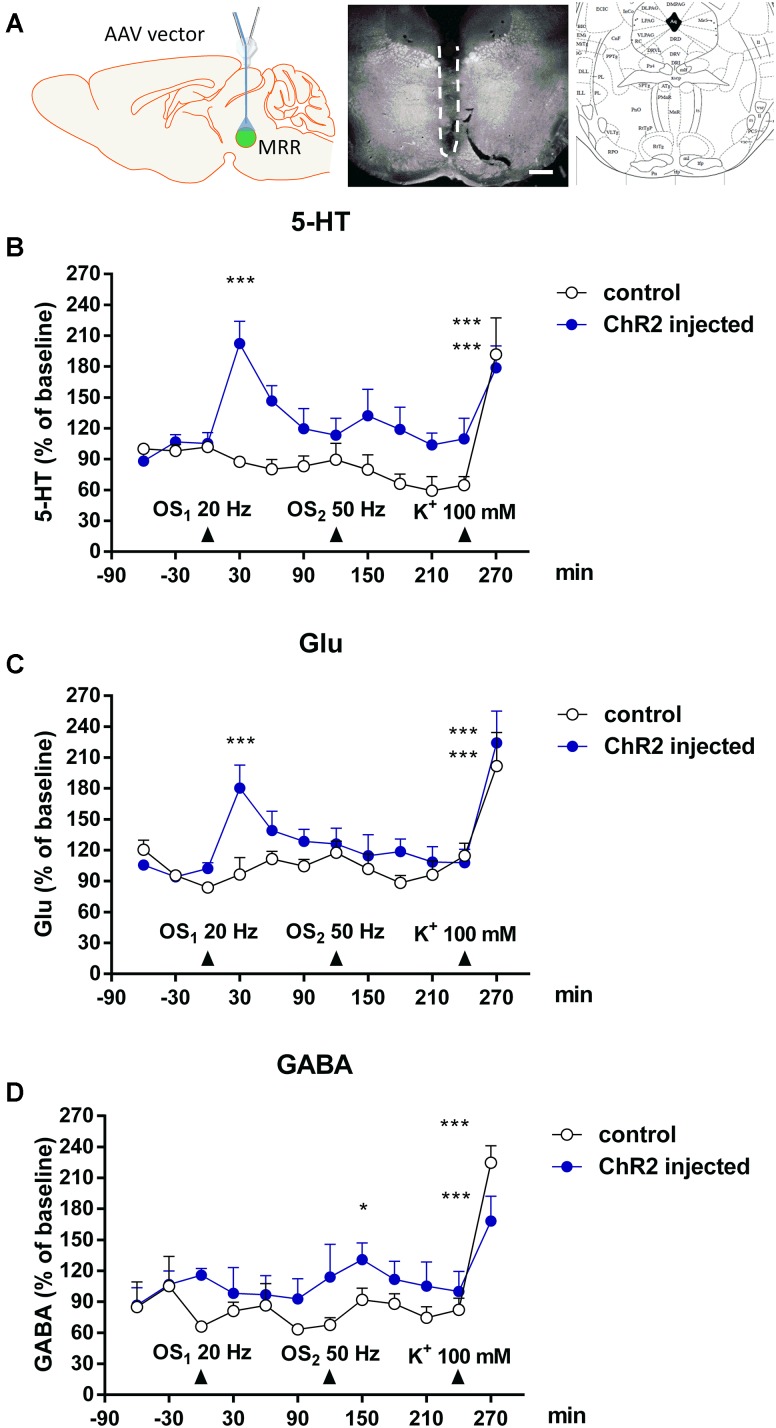
FIGURE 7.
In vivo light and K+ stimulation increased 5-HT, Glu and GABA levels in MMR. (A) Left: The location of microdialysis probe and optic fiber in stimulated mice. Center: Dark field photomicrograph shows the injury (indicated by dashed line) caused by microdialysis probe in the dorsal (DR) and medial raphe nucleus (MR). Right: Insert from the Paxinos mouse brain atlas –4.60 mm from the Bregma shows the appropriate area. Scale bars: 500 μm. (B,C) Optical stimulations (OS1: 20 Hz 5 min) increased the 5-HT and Glu level in the MRR in virus injected mice. (D) Second optical stimulation (OS2: 50 Hz, 5 min) increased the GABA level in the MRR. (B–D) Arrows indicate the time of different type of light and chemical stimulations. Data are expressed as % of baseline as means ± SEM (n = 5 or 10 per group). Results were analyzed by two-way factorial ANOVA, followed by Dunnett / Fischer LSD (GABA) post hoc test ∗p < 0.05, ∗∗∗p < 0.001. Asterisks indicate significant differences from baseline. (A) Created by modifying images purchased in the PPT Drawing Toolkits-BIOLOGY Bundle from Motifolio, Inc. (http://www.motifolio.com/neuroscience.html).

