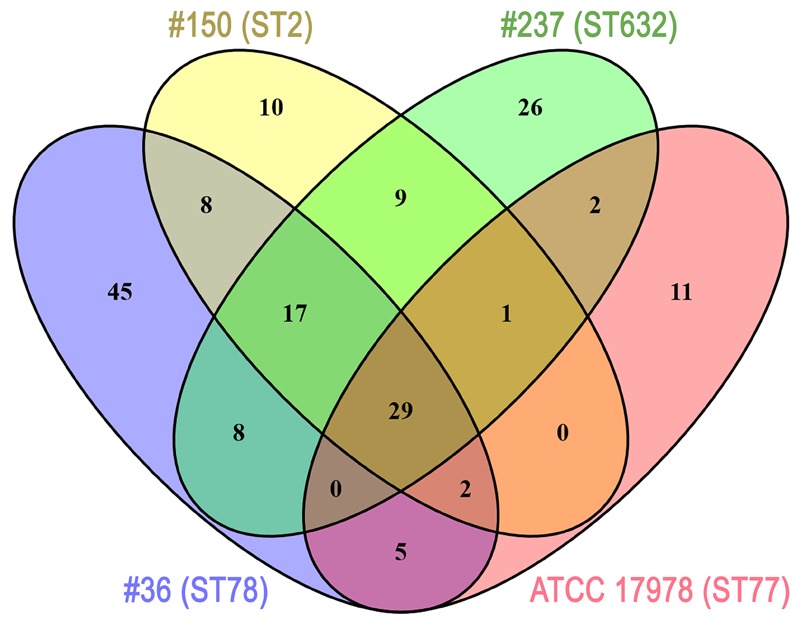
FIGURE 2.

Venn diagram showing the number of proteins shared among A. baumannii strains. Each A. baumannii isolate is depicted by a different oval color, as indicated. Proteins included were those identified by MS (cut-off: protein confidence = 95%) in the 20–36 kDa range from the Coomassie-stained gel shown in Figure 1, and having at least 95% = 4 minimum peptides. Numbers in the non-overlapping regions show the number of proteins unique to that strain. Supplementary Table S2 contains the information shown in this diagram at the protein level.
