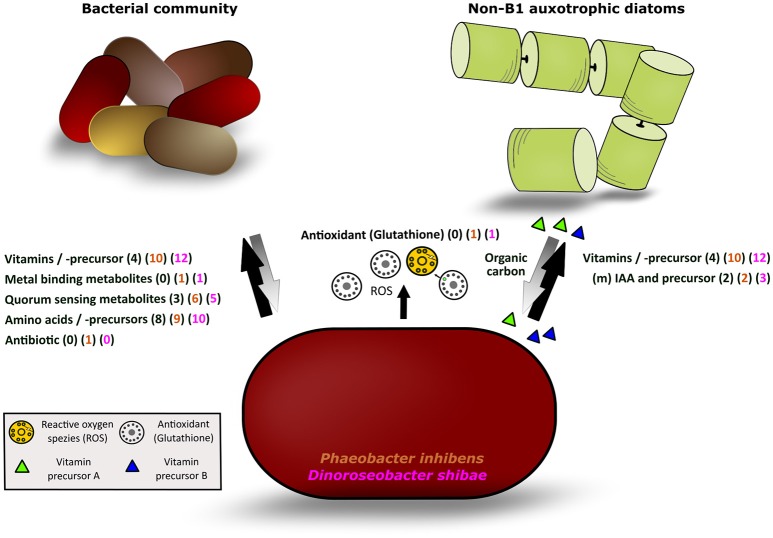
Figure 5.
Illustration of the different classes of exometabolites released by P. inhibens and D. shibae and mutualisms with other bacteria and phytoplankton algae. Black arrow: detected metabolites released by both strains; gray arrow: potential response of the bacterial or phytoplankton communities to the bacteria releasing metabolites; in parentheses, the number of exometabolites of each class detected in the natural phytoplankton bloom (black) and released by P. inhibens (brown) and D. shibae (pink) are given.

