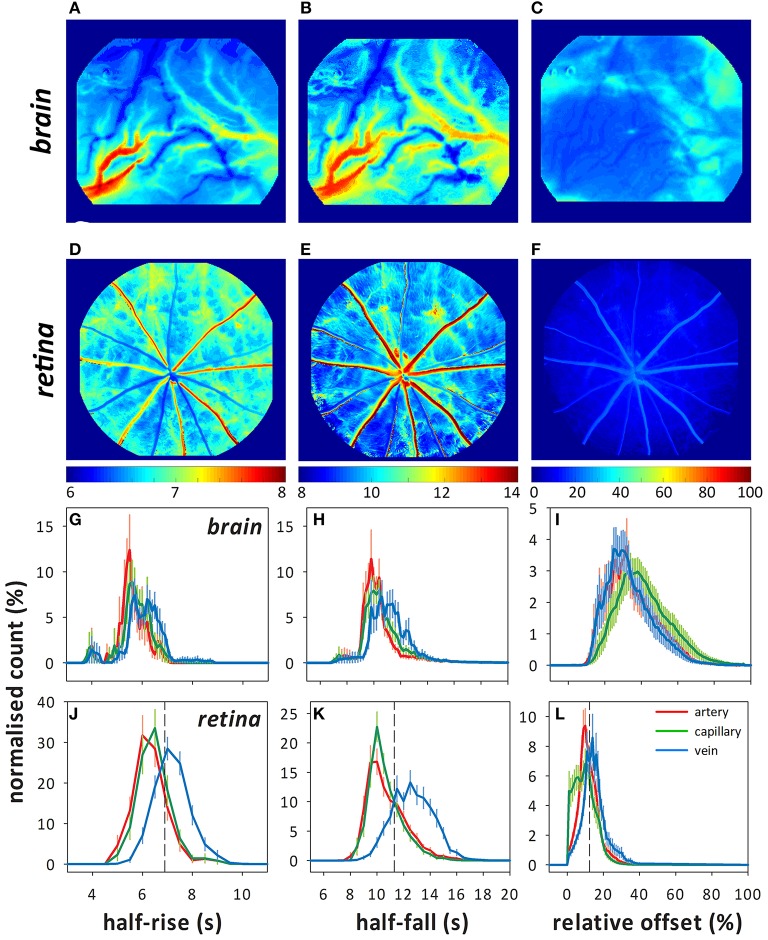
Figure 2.
Representative color maps showing the fluorescence indices (half-rise, half-fall, and offset) determined using pixel-by-pixel analysis in the brain (A–C) and retina (D–F). Frequency histograms (normalized count to total number of pixels, %) for each index in the brain (G–I) and retina (J–L) showing the distribution of the fluorescence indices for arteries (red), capillaries (green), and veins (blue). Dashed lines in (J–K) indicate where the 75% quartile lies for the capillary data, which is used for calculating the index of injury.

