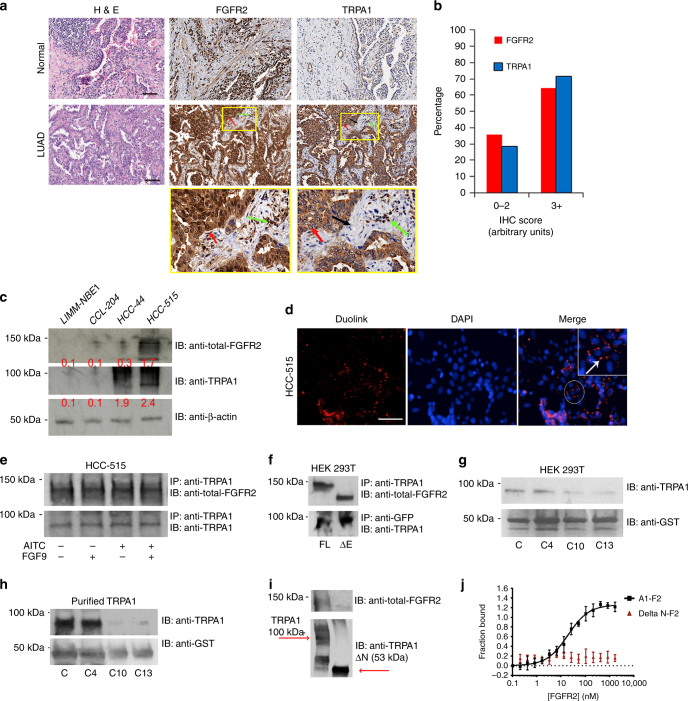
Fig. 1.
FGFR2 binds directly to TRPA1 ankyrin repeats via its C-terminal proline-rich motif. a Representative image of haematoxylin and eosin (H&E) stain and immunohistochemistry (IHC) staining with FGFR2 and TRPA1 antibodies of a lung cancer tissue microarray. Scale bar: 10 μm. Neoplastic epithelial cells are indicated by the red arrow, inflammatory cells by the green arrow, and supporting stroma (fibroblasts) by the black arrow. b Fraction of total LUAD samples (in percentage) in the tissue microarrays (TMAs) with the indicated pathological scores. c Western blots for the expression levels of FGFR2 and TRPA1 in LIMM-NBE1, CCL-204, HCC-515, and HCC-44 cell lines. Normalized densitometric values (in relative arbitrary units) are reported in red below each band and represent the average of three independent experiments. d Duolink assay results with an example of a PLA signal depicted by the white arrow. Scale bar: 50 μm. e Western blot analysis of an immunoprecipitation (IP with anti-TRPA1) in HCC-515 cell line followed by immunoblotting (IB) with the indicated antibodies. f Western blot analysis of an IP in HEK 293T cells transfected with full-length TRPA1 with either full-length FGFR2 (FL) or extracellular region-truncated FGFR2 (ΔE). IP and IB were performed with the indicated antibodies. g GST pull-down results in HEK 293T cells transfected with TRPA1 and C, C4, C10, and C13 GST-constructs on GST beads. h GST pull-down experiment with full-length purified TRPA1 and C, C4, C10, and C13 GST-constructs on GST beads. i Western blot analysis of purified biotinylated full-length TRPA1 or ankyrin repeats-truncated TRPA1 (ΔN) proteins immobilized on streptavidin beads and incubated with full-length purified FGFR2. j Microscale thermophoresis (MST) curve of purified full-length FGFR2 (F2; titrated in a range of concentrations) with purified full-length TRPA1 (A1) or ΔN. Apparent dissociation constant K d for A1-F2 was 122.8 ± 23.4 nM. Error bars represent the s.d. of each data point (n = 7)

