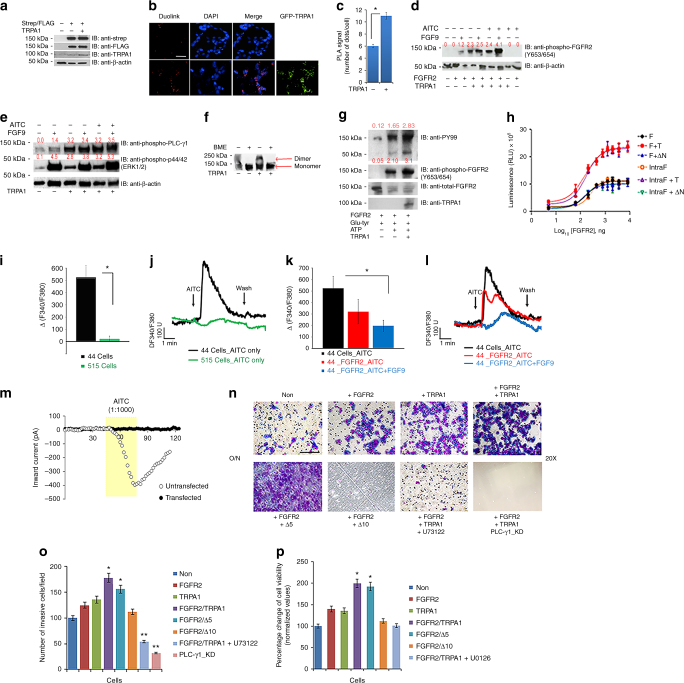
Fig. 3.
FGFR2-TRPA1 binding event results in FGFR2 activation, but TRPA1 inhibition. a Western blot showing the efficiency of transfection of Strep-tagged FGFR2, FLAG-tagged FGFR2, and TRPA1-GFP in HEK 293T cells. b, c Duolink assay in HEK 293T cells using antibodies targeted against Strep-tagged and FLAG-tagged FGFR2 in the absence (upper panel) or presence (bottom panel) of TRPA1. Scale bar: 50 μm. PLA signals are quantified in (c). d Western blot analysis of differentially transfected and treated HEK 293T cells. The blot was probed with the indicated antibodies. e Western blot analysis of HEK 293T cells transfected with FGFR2 in all samples but differentially transfected with TRPA1. The blot was probed with the indicated antibodies. f Western blot analysis of purified FGFR2 dimerization assay (under non-reducing or reducing conditions) in the presence or absence of purified TRPA1. g Western blot analysis of an in vitro receptor kinase assay in the presence or absence of purified TRPA1. h Luminescent kinase assay results of purified full length FGFR2 (F) and intracellular cytoplasmic region of FGFR2 (IntraF) in the presence or absence of full-length TRPA1 (T) or ΔN. Intensity of the luminescence signal is measured in relative luminescence units (RLU). i–k Bar graphs of the averaged calcium imaging results (Δ F340/380) with representative traces of calcium responses. m Example inward currents, from a holding potential of −60 mV, evoked in untransfected (○) and FGFR2-transfected HCC-44 cells (●) by the application of AITC (1:1000 in the perfusate). Currents were recorded at 2 s intervals for a control period, during application of AITC and then during washout. n Representative images of an invasion assay using differentially transfected HEK 293T that were incubated over night (O/N) in serum starvation media. Lower chamber contains 1% FBS-supplemented media. Images were taken at 20× magnification (scale bar: 100 μm). U73122 is PLC-γ1 inhibitor and PLC-γ1_KD designates HEK 293T cell line with knocked down PLC-γ1. o Quantification of the results from (n), where the number of invaded cells were counted in 6 different microscopic fields/well. p MTT assay results of differentially transfected HEK 293T cells with or without U0126 (MEK inhibitor) treatment. Percentage change in cell viability for each sample with respect to the untransfected control sample (Non) is depicted on the Y-axis. In the above, error bars, s.d. (n = 3 biological replicates). *P ≤ 0.05 and **P ≤ 0.01 were determined by two-tailed Student’s t test

