Fig. 4.
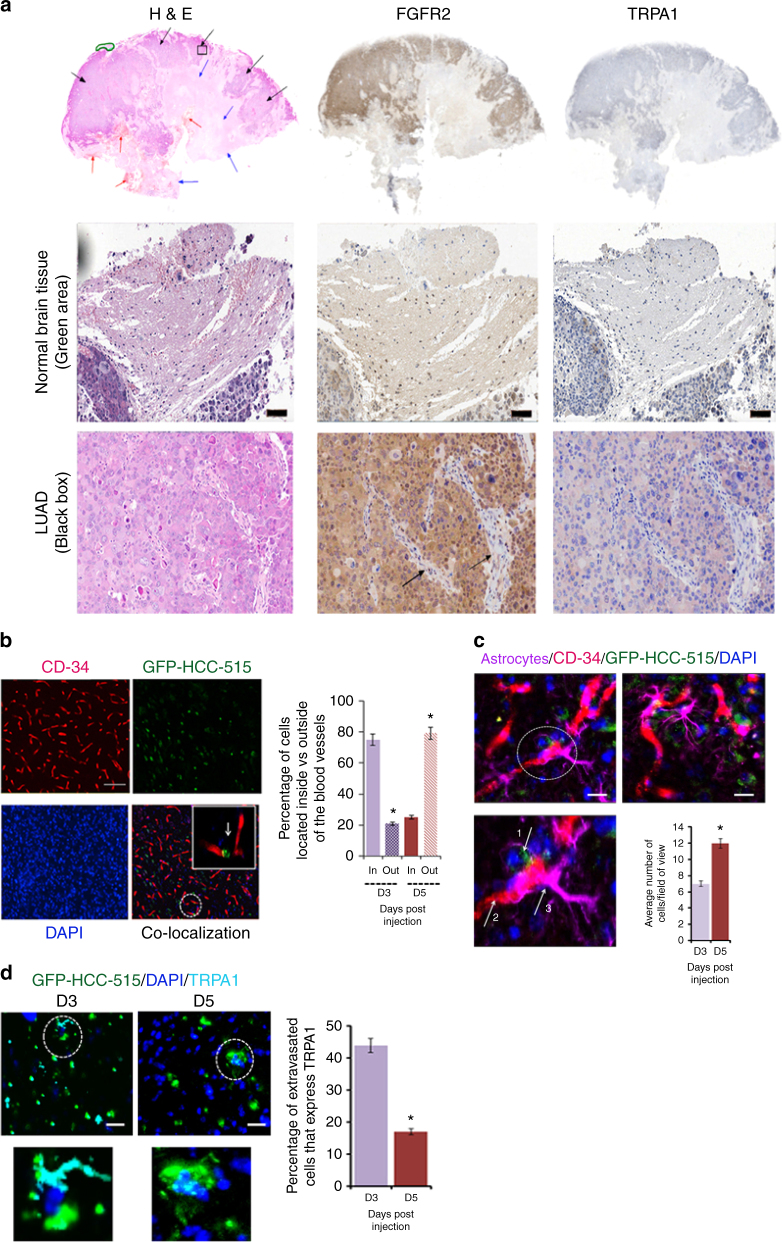
TRPA1 expression level is significantly reduced upon LUAD brain metastasis. a IHC and H&E staining of lung cancer brain metastases. Upper panel: Normal brain tissue (green area), tumor tissue (black arrows), necrosis (blue arrows), and haemorrhage (red arrows). Middle panel: Higher magnification of normal brain (scale bar: 100 μm). Bottom panel: Higher magnification of metastatic lung cancer (scale bar: 200 μm) shows FGFR2-positive tumor cells with areas of negatively-stained fibrovascular connective tissue (black arrows). b Left panel: Images of IF staining at 20× magnification of mouse brain slices 5 days following injection with GFP-HCC-515. CD-34 (Alexa 555) was used as a blood vessel marker. Scale bars: 20 μm. Right panel: Percentage of cancer cells located inside vs. outside blood vessels 3 days (D3) and 5 days (D5) following injection. Error bars indicate s.d. *P ≤ 0.05. c Left panel: Two representative images from D5 (one with an additional zoom-in area). GFAP-positive reactive astrocytes (Alexa 647; pseudo colour: magenta) are shown in the vicinity of extravasating cancer cells (green) as indicated by the white arrows (arrow 1: cancer cell; arrow 2: blood vessel; and arrow 3: astrocyte). Scale bars: 20 μm. Right panel: Bar graph representation of the number of activated astrocytes present in the vicinity of cancer cells 3 days (D3) and 5 days (D5) following injection. Cancer cell-associated astrocytes are quantified within a distance of 150-μm from cancer cells. Error bars indicate s.d. *P ≤ 0.05. d Left panel: TRPA1 expression (Alexa 647; pseudo colour: cyan) in cancer cells 3 days (D3) and 5 days (D5) following injection. Scale bars: 20 μm. Right panel: Extravasated cancer cells were counted in 20 randomly chosen fields per brain followed by calculation of TRPA1-positive cells. Error bars indicate s.d. *P ≤ 0.05

