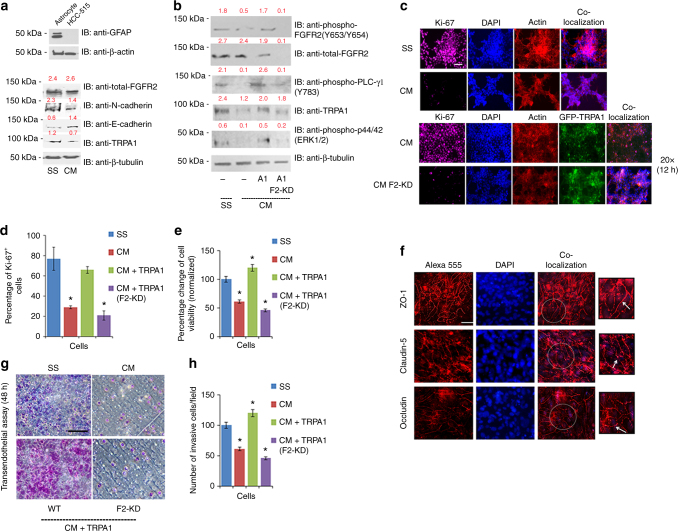
Fig. 5.
Astrocytes decrease the proliferative and invasive potential of cancer cells by reducing TRPA1 expression level. a Upper panel: western blot analysis of GFAP expression level in astrocytes with HCC-515 cells used as a negative control. Bottom panel: western blot analysis of HCC-515 cells that have been serum starved (SS) or treated with conditioned media (CM). The blot was probed with the indicated antibodies. Normalized densitometric values are reported in red above each band throughout the figure and represent the average of three independent experiments. b Western blot analysis of HCC-515 cells without TRPA1 transfection (−), with TRPA1 transfection and scrambled shRNA (A1) or with TRPA1 transfection and FGFR2 knockdown (A1/F2_KD). In all cases, blots were probed with the indicated antibodies. c IF of HCC-515 cells stained with the proliferation marker, Ki-67. Scale bar: 50 μm. d Bar graph quantification of (c), where the number of Ki-67+ cells were counted under the same magnification in 6 random microscopic fields/sample and averaged. Error bars indicate s.d. (n = 3 biological replicates). *P ≤ 0.05 by two-tailed Student’s t test. e Results of an MTT assay performed overnight and normalized against the values obtained for SS-treated-cells. Error bars indicate s.d. (n = 3 biological replicates). *P ≤ 0.05 by two-tailed Student’s t test. f IF of tight junction proteins (ZO-1, Occludin and Claudin-5 depicted by white arrows in the zoom-in area) in RBE4 cells with different paracellular permeability that were grown in a trans-well chamber. TEER measurement of the integrity of the cellular barrier ranged in value between 150 and 200 ohm cm2. Scale bars: 20 μm. g Representative images of a transendothelial assay with RBE4 monolayer from (f) utilized as a cellular barrier on top of which HCC-515 cells were incubated in SS media or CM media with 1% serum-supplemented media in the lower chamber. Images were taken at 20× magnification. Scale bar: 100 μm. h Quantification of the transendothelial assay results, where the number of invaded cells were counted in 8 different microscopic fields. Error bars indicate s.d. (n = 3 biological replicates). *P ≤ 0.05 by two-tailed Student’s t test

