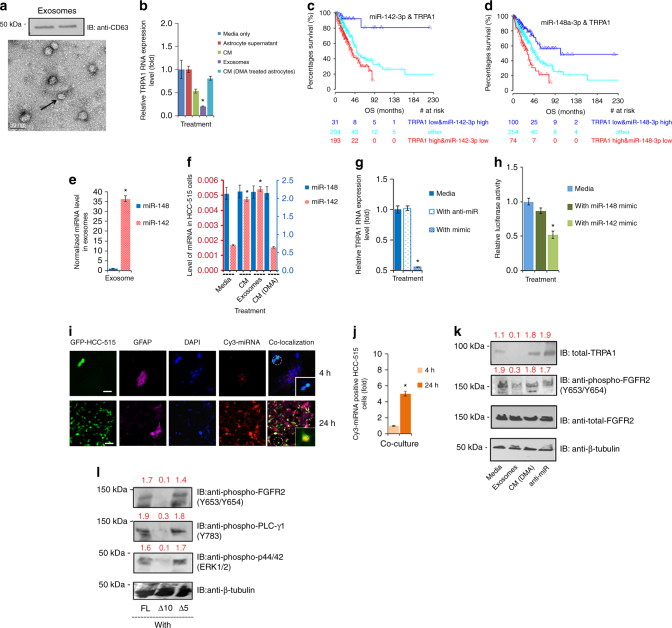
Fig. 6.
TRPA1-targeting miR-142-3p is intercellularly transferred from astrocytes to HCC-515 cells. a TEM image (Scale bar: 50 nm) and western blot analysis (loaded samples are from two separate experiments) of purified exosomes. The blot was probed with CD63 antibody. b Bar graph depicting normalized TRPA1 mRNA level in HCC-515 cells treated overnight with SS media (normalization control), astrocyte supernatant, which lacks exosomes, astrocyte-CM, 200 μl of 100X concentrated exosomes and CM from astrocytes that have been treated for 4 h with DMA (inhibitor of exosomal release). c, d Kaplan–Meier curve depicting the correlation of TRPA1, miR-142-3p, and miR-148-3p with patient survival. The numbers of patients at risk at different time points are presented at the bottom of the graph. The calculated log-rank test value yielded P = 0.00001 (c) and P = 0.00002 (d), respectively. The median of overall survival (OS) in months is shown. e, f Bar graphs showing the level of miRNA in exosomes and differentially treated HCC-515 cells. g Bar graph representation of the changes in TRPA1 mRNA levels in HCC-515 cells following their treatment with SS media only, SS media + anti-miR (miR-142-3p inhibitor) and SS media + miR-142-3p mimic. h Bar graph of the 3′-UTR luciferase assay results obtained from HEK 293T cells in the abence or presence of mimics. i IF staining images of the intercellular transfer of miR-142-3p, 4 h or 24 h following the co-culture of HCC-515 (expressing an empty GFP vector) with astrocytes that have been loaded with Cy-3-labeled miR142-3p. GFAP (Alexa 647 with magenta as a pseudo-colour) was utilized as an astrocytic marker to distinguish them from cancer cells. Scale bar is 50 μm. j Bar graph representation of the results from i) counted at 20× magnification in eight randomly selected microscopic fields. k Western blot analysis of HCC-515 after variable overnight treatments followed by probing with the indicated antibodies. Normalized densitometric values represent the average of three independent experiments. l Western blot analysis of HCC-515 cells 6 h post-transfection with the indicated constructs following their overnight treatment with exosomes. The blot was probed with the indicated antibodies. In the above, error bars, s.d. (n = 3 biological replicates). *P ≤ 0.05 and **P ≤ 0.01 by two-tailed Student’s t test

