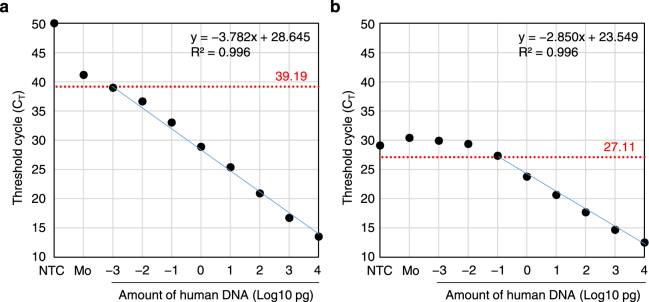
Figure 4.
Standard Curve for Detecting Human Genomic DNA among a Total of 100 ng of Mixed Human and Mouse Genomic DNA Using the Primer and Probe Set Devised in this Study (101 F, 206 R, and 144RH) (a) and that of McBride et al. (98 F, 188 R, and 133FH) (b). qPCR was performed for duplicate samples in one run, and the mean CT values were plotted. For non-detected samples, the CT values were assumed to be for 50 cycles. Negative control samples included TE buffer for the no-template control (NTC) and a sample of mouse genomic DNA only (Mo). Threshold cycles of detection were set at 2 cycles below the lower CT value between NTC and Mo (red dotted lines), and the corresponding number of cycles is shown in red. The equations for linear approximations (blue lines) and the R2 values are also shown.

