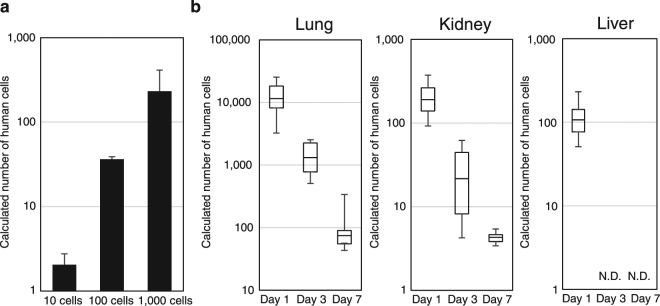
Figure 5.
Detection of Human Cells in Mouse Xenotransplantation Models. (a) Detection of human cells in subrenal capsule assays. The indicated numbers of NHDF cells were injected into mouse subrenal capsules, and the numbers of cells calculated from the Alu-qPCR experiments are shown. qPCR was performed for triplicate samples in one run. Data represent the means, and bars indicate standard deviations for n = 3. (b) Detection of human cells in mouse organs at 1 day, 3 days, and 7 days after the injection of hMSCs into NOD/SCID mice via tail vein. qPCR was performed for triplicate samples in one run. The numbers of human cells calculated from the amount of human genomic DNA extracted from the lung, kidney, and liver are shown as box plots (n = 6). Whiskers represent minimum and maximum values, and the bold horizontal line represents the median. N.D. means not detected.

