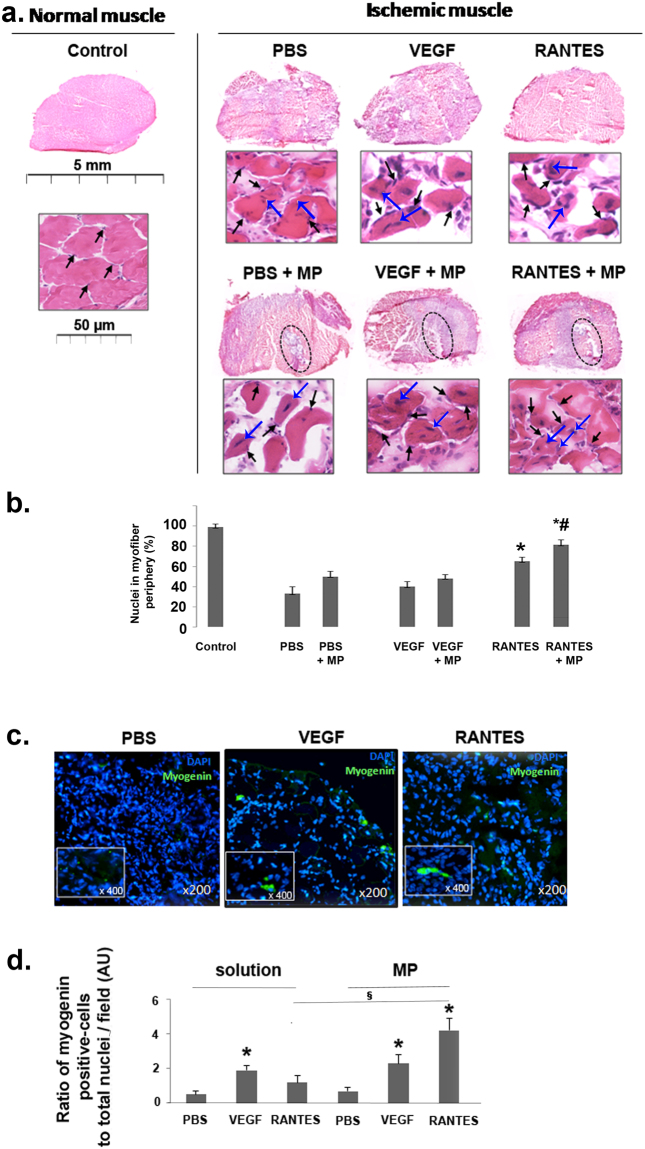
Figure 2.
Induction of muscle regeneration after hindlimb ischemia. (a) Regeneration process after ischemia was analyzed in the muscles cross-sections stained with haematoxylin-eosin (upper panels, scale bar = 5 mm and lower panels, scale bar = 50 μm) after treatment with PBS, VEGF and RANTES solution or after treatment with PBS-, VEGF- or RANTES-loaded MP. The zone of MP injection was circled. Black arrows indicate the nuclear localization in the periphery of the mature muscle fibers. Blue arrows indicate the nuclear localization in the central part of the activated immature muscle fibers. Images were chosen as representative of total cross-section analysis of 5 muscles per group. (b) Histogram represents the percentage of nuclei located in the periphery of myofibers in muscle cryosection of mice treated with PBS, VEGF (2 nM) or RANTES (10 nM) solutions or with MP-loaded with PBS, VEGF (2 mM) or RANTES (10 nM),*P < 0.05 versus PBS, § P < 0.05 RANTES-loaded MP versus RANTES solution. (c) Ten days after hindlimb ischemia, the MP-injected tissue cryosections were immunolabeled with anti-myogenin D antibody revealed with Alexa Fluor 488 (green) secondary antibodies whereas the nuclei were stained with DAPI (blue). Magnification: × 200, inset × 400. (d) Histogram represents the ratio of myogenin D positive cells per total nuclei in cryosection field of mice treated with PBS, VEGF (2 nM) or RANTES (10 nM) solutions or with MP-loaded with PBS, VEGF (2 nM) or RANTES (10 nM),*P < 0.05 versus PBS, § P < 0.05 RANTES-loaded MP versus RANTES solution.

