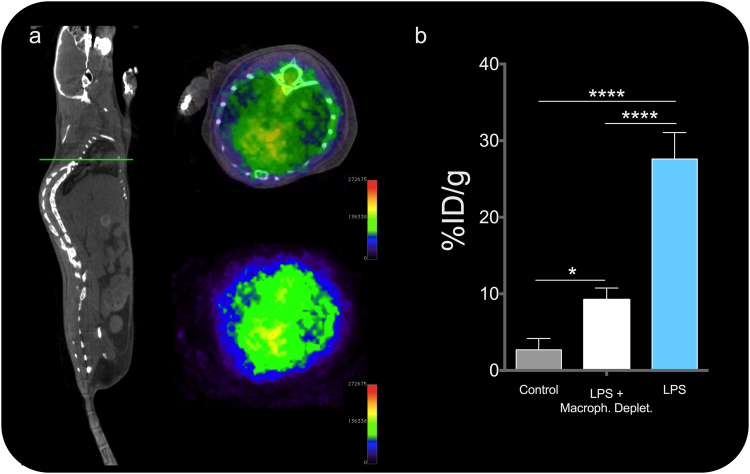
Figure 4.
(a) PET/CT image of a macrophage-depleted LPS-treated mouse 1 h post i.v. injection with 68Ga-NRT-cFLFL F. Left, whole body CT image of a representative mouse, green line indicates the plane which PET/CT and PET is shown next. (b) Radiotracer accumulation (%ID/g) in the lungs of LPS-instilled mice injected with 68Ga-NRT (black) or 68Ga-NRT-cFLFLF (white) and in the lungs of macrophage-depleted LPS-instilled mice injected with 68Ga-NRT-cFLFLF (grey). ****P < 0.0001, *P < 0.05, one-way ANOVA; error bars indicate s.d., N = 3. Experiment repeated twice.

