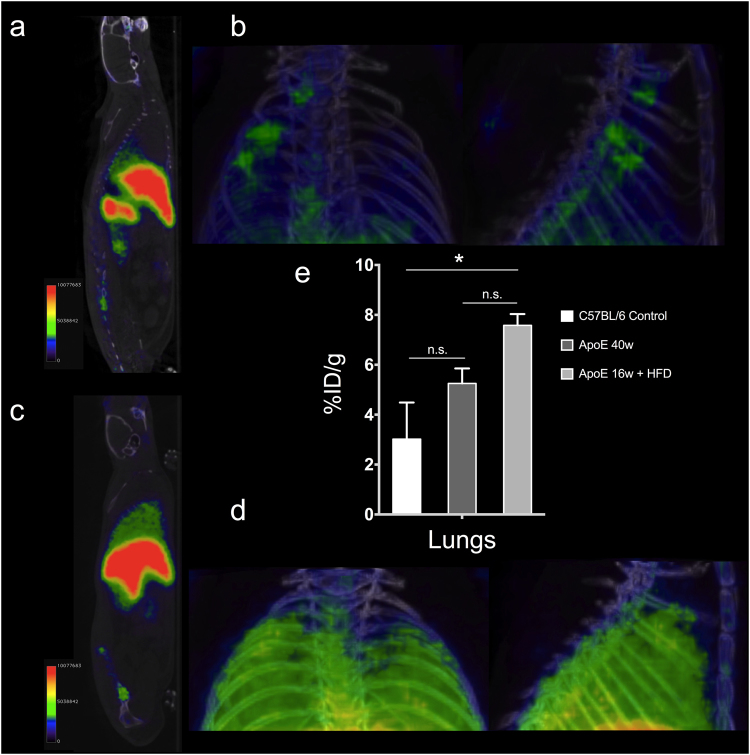
Figure 5.
(a) PET/CT imaging 1 h post i.v. injection of 68Ga-NRT-cFLFLF in 40-week-old ApoE−/− mice. (b) PET/CT maximum intensity projection of the pulmonary region 1 h post i.v. injection of 68Ga-NRT-cFLFLF in 40-week-old ApoE−/− mice. (c) PET/CT imaging 1 h post i.v. injection of 68Ga-NRT-cFLFLF in 16-week-old ApoE−/− mice fed a high-fat diet (HFD). (d) PET/CT maximum intensity projection of pulmonary region 1 h post i.v. injection of 68Ga-NRT-cFLFLF in 16-week-old ApoE−/− mice fed a high-fat diet (HFD). (e) Organ biodistribution expressed as %ID/g in C57BL/6 mice, 40-week-old ApoE−/− mice, and 16-week-old HFD ApoE−/− mice. *P < 0.05, one-way ANOVA; error bars indicate s.d., N = 3.

