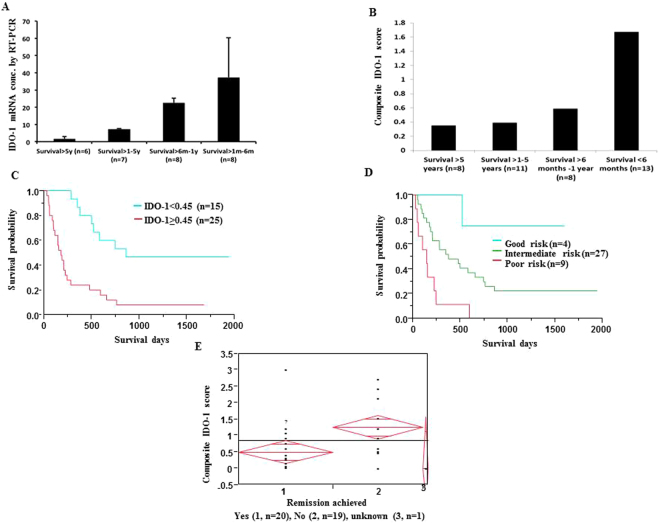
Figure 1.
Composite IDO-1 score at diagnosis identifies patients at the highest risk of induction failure and early death. (A) IDO-1 mRNA expression by RT-PCR, normalized to 18S ribosomal RNA. The highest IDO-1 expression was found in the shortest survival group. Increased IDO-1 mRNA correlates with a shorter OS (*p = 0.01). (B) Composite IDO-1 score for each of the 4 survival groups, with highest IDO-1 expression correlating with a shorter OS. (C) Kaplan-Meir survival analysis of patients arbitrarily divided into two cohorts based on their composite IDO-1 score: “low” (<0.45) and “high” (≥0.45) (*p = 0.0005). (D) Kaplan-Meir survival analysis of composite IDO-1 score among the three risk groups as per the ELN classification system (*p = 0.005). (E) Figure showing patients who failed induction had higher composite IDO-1 scores (*p = 0.01).

