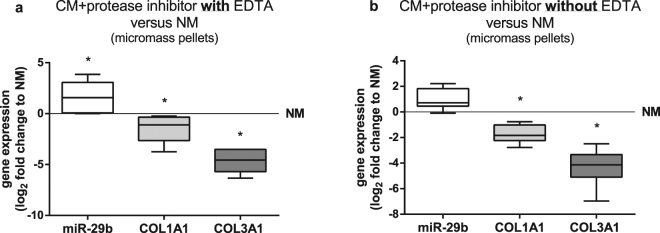
Figure 6.
Gene expression of BMSC cultured in conditioned medium supplemented with protease inhibitors. miR-29b (white bars), COL1A1 (light grey bars) and COL3A1 (dark grey bars) gene expression of BMSC kept in micromass pellets and cultured for 7 days in chondrogenic medium conditioned with OA cartilage (CM) and supplemented with protease inhibitor cocktail including EDTA which additionally inhibits matrix metalloproteases (a) or without EDTA (b) compared to non-conditioned chondrogenic medium (NM, zero line, n = 7). Results are expressed as box plots with median, the 25th and 75th percentiles and whiskers showing the largest and smallest values. * = p < 0.05; non-parametric Wilcoxon signed rank test for paired analysis. CM: with OA cartilage conditioned medium; NM: non-conditioned medium.

