Figure 1.

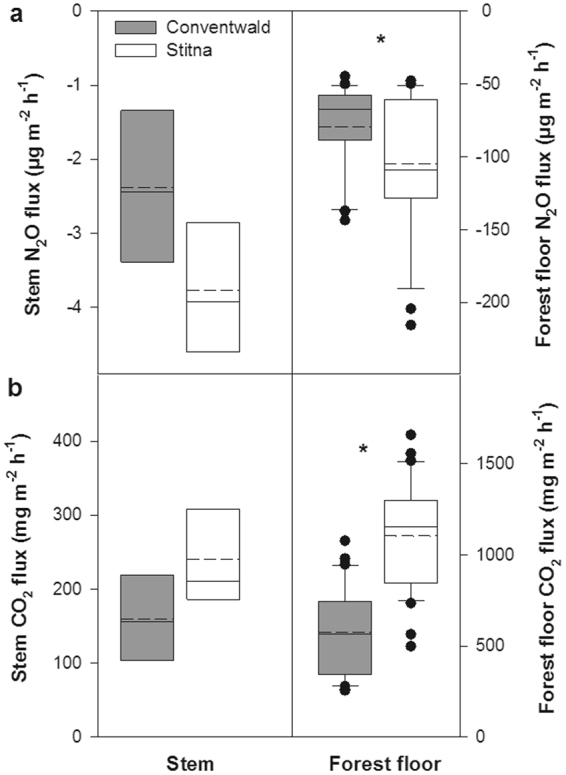
N2O (a) and CO2 (b) fluxes at beech stem and forest floor level in two beech forest stands (Conventwald, Black Forest; Stitna, White Carpathians) measured during June–July 2015. Negative fluxes indicate N2O uptake/consumption. Fluxes are expressed per m2 of stem or soil surface area, respectively. Stem fluxes were determined for five trees per forest stand (n = 5) at three stem heights with 3–4 measurement repetitions per each height and tree. Stem fluxes from different tree heights are presented together as they did not significantly vary with the tree height. Forest floor fluxes were quantified from 23 (n = 23) and 31 (n = 31) positions randomly distributed within the studied forest stands at Conventwald and Stitna, respectively. Fluxes are expressed as medians (solid lines) and means (broken lines). Boundaries within the boxes indicate 25th and 75th percentiles, and the whiskers 10th and 90th percentiles. Dots mark outliers. Statistically significant differences at p < 0.05 are indicated by asterisk.
